What is Technical Analysis? Technical analysis is a method used by traders to predict future price movements in the forex market based on past price data. Instead of focusing on external factors like economic news or company fundamentals, technical analysis relies on chart patterns and statistical indicators. It helps traders identify trends and potential entry and exit points for their trades. In this article, we will Discover support resistance and chart types in Forex trading.
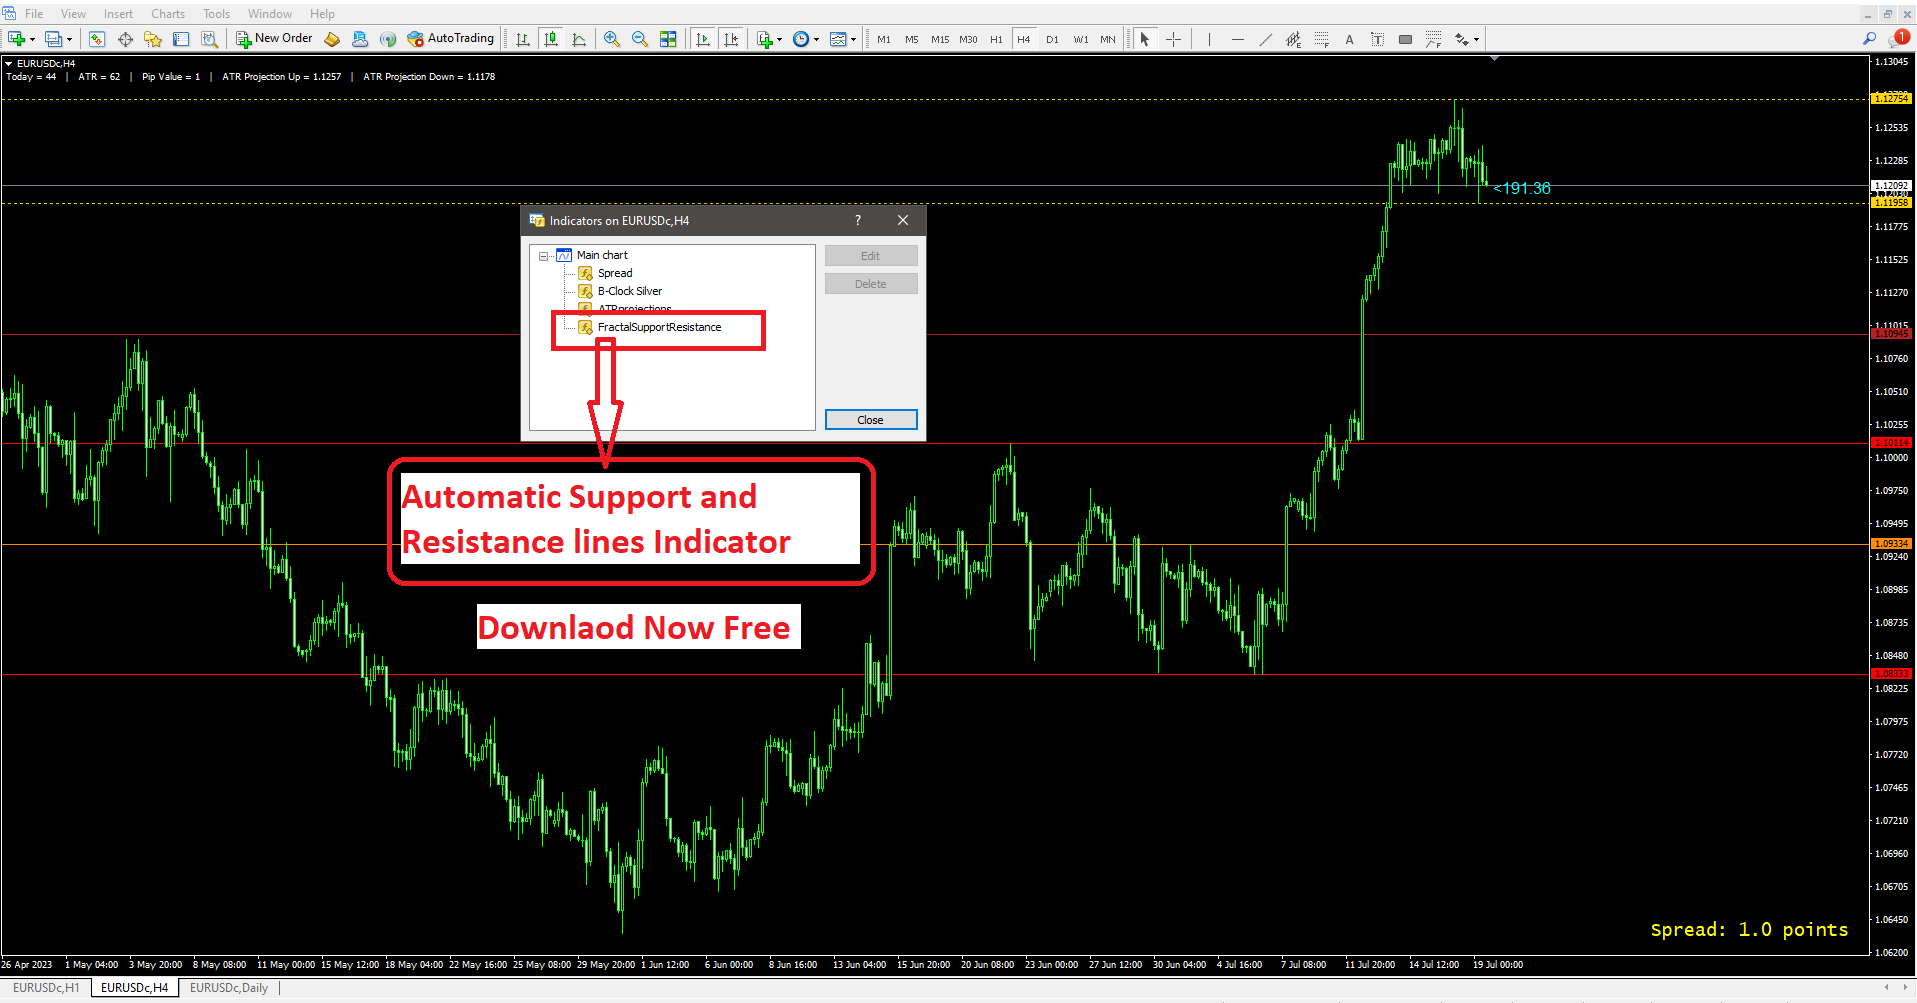
In simple terms, technical analysis is like reading the story of price movements on a chart. By understanding the patterns that have occurred in the past, traders aim to make informed decisions about what might happen in the future. As you see in the future image Automatic support and resistance line indicator (FractalSupportResistance.ex4), you will find the free download link at the bottom of the article.
Which Forex broker is reliable for Forex trading and has less spread and instant withdrawal?
Real-life example: Let’s say you want to buy a new smartphone, but you’re not sure about the best time to make the purchase. Using technical analysis, you look at the price history of the smartphone over the past few months. You notice that every time the price dropped to a certain level, it rebounded and went higher. This could be a support level. So, you decide to wait for the price to reach that level before making your purchase, expecting the same pattern to repeat.
Importance of Technical Analysis in Forex Trading
Technical analysis is vital in forex trading because it provides valuable insights into market sentiment and potential price movements. By analyzing charts and identifying trends, traders can make more informed decisions and increase their chances of success.
One of the significant advantages of technical analysis is its universal applicability. It can be used in any financial market, including stocks, commodities, and forex. This versatility makes it a powerful tool for traders of all levels.
Real-life example: Imagine you’re planning a trip to a foreign country and need to exchange your currency. You notice that the exchange rate of your home currency against the foreign currency has been steadily declining on the forex chart. Technical analysis suggests that there might be a resistance level, where the currency might strengthen again. Based on this information, you decide to wait for the rate to reach that level before exchanging your money, potentially getting a better rate.
Technical Analysis Key Principles and Assumptions
CL2. What is the Forex market and how does it’s work?
In technical analysis, there are several key principles and assumptions that traders follow:
- Price Discounts Everything: This principle states that all relevant information, including economic data and market news, is already reflected in the price. Therefore, there’s no need to analyze external factors separately.
- History Repeats Itself: Technical analysis assumes that price patterns and trends that occurred in the past are likely to repeat in the future. These patterns can help traders predict potential future price movements.
- Support and Resistance: The concept of support and resistance levels suggests that certain price levels tend to act as barriers where price movements may reverse or stall.
Real-life example: Let’s say a certain currency pair has consistently struggled to go above a specific price level, say 1.2000. Technical analysis indicates that this level is a strong resistance. As a result, traders may anticipate that the currency pair will face difficulty moving above this level again in the future and plan their trades accordingly.
Remember, technical analysis is not foolproof, and no strategy can guarantee profits in the forex market. It is essential to combine technical analysis with risk management and other analytical tools for successful trading.
Types of Charts in Technical Analysis
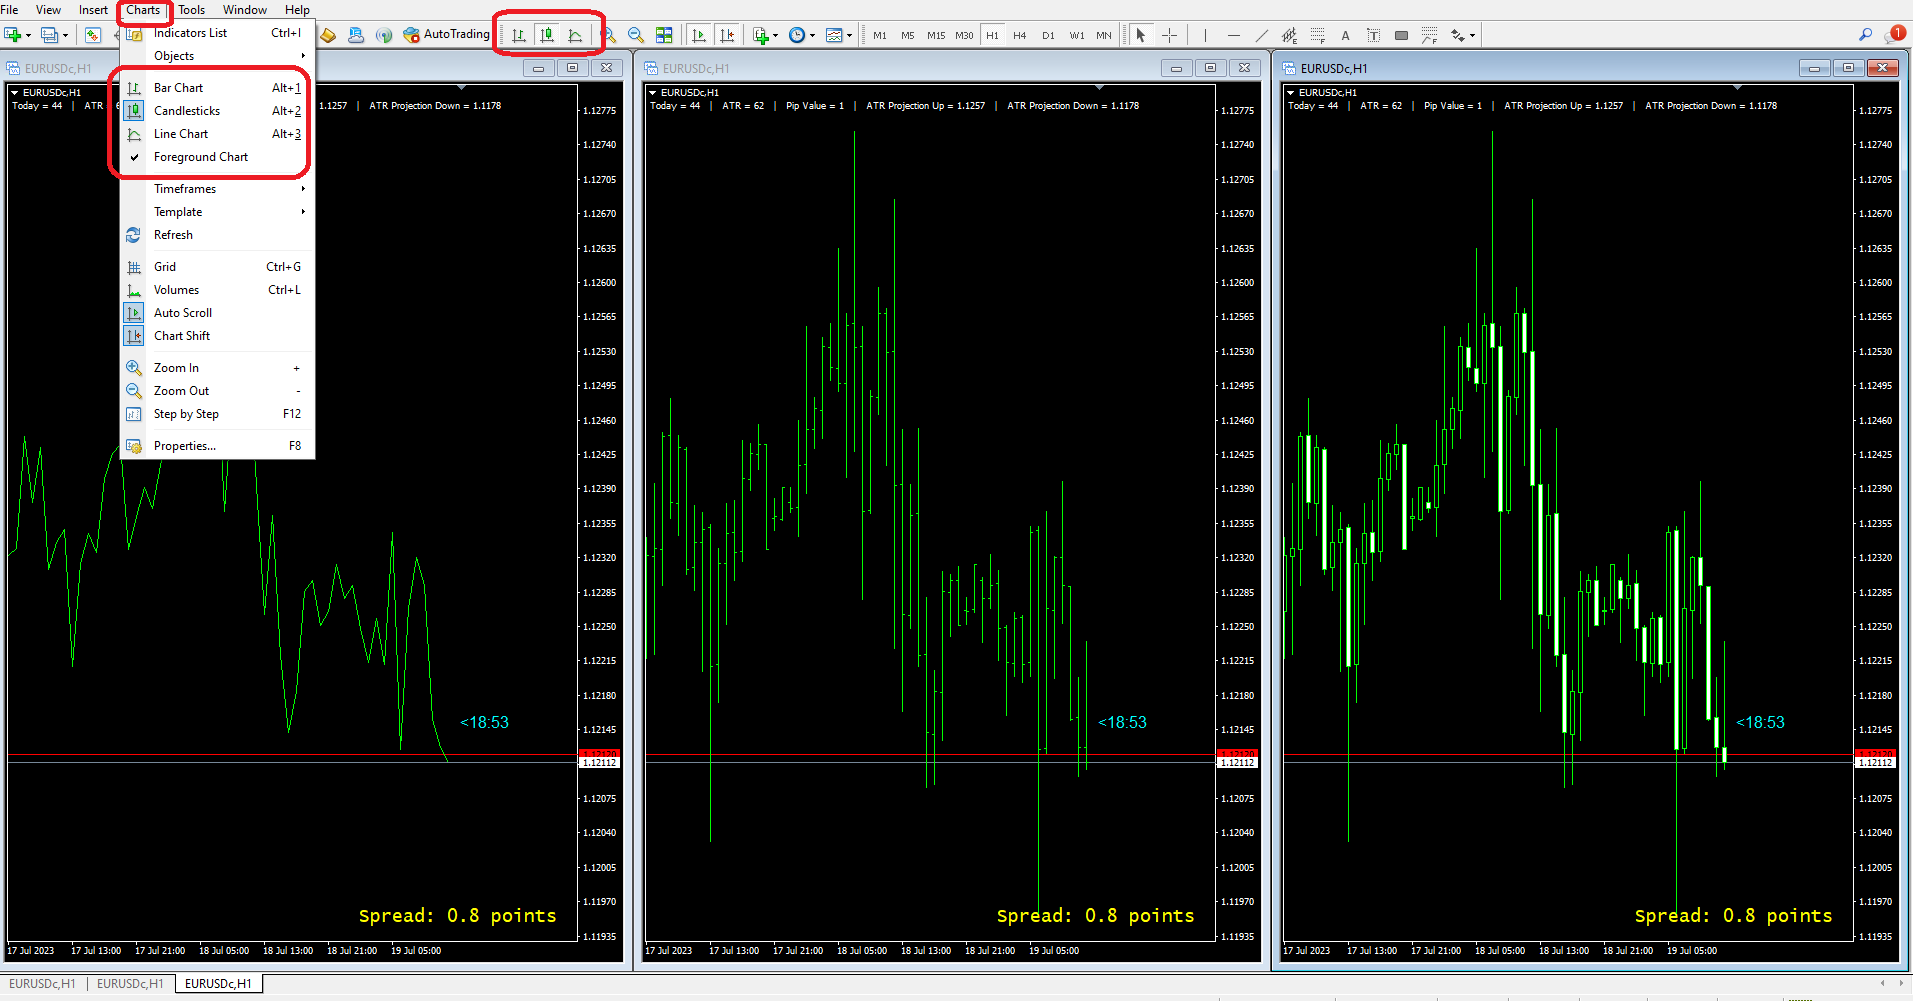
A. Line Charts
- Definition and Use: Line charts are a simple and commonly used type of chart in technical analysis. They display the price movements of a financial instrument over a specified period, connecting the closing prices of each period with a line. Line charts are especially helpful in identifying overall trends and are easy to understand, making them suitable for beginners.
- Real-life example: Imagine you are tracking the price of a popular stock over a week. Each day, you note down the closing price and plot these points on a chart. By connecting these points with a line, you get a clear visual representation of how the stock’s price has changed over the week, giving you insights into its general direction.
- Pros and Cons:
- Pros:
- Simple and easy to interpret, ideal for beginners.
- Clearly highlights long-term trends and direction.
- Helps identify significant support and resistance levels.
- Cons:
- May lack specific details like high, low, and open prices.
- Less effective in pinpointing short-term price fluctuations.
- Additional indicators may be required for more in-depth analysis.
B. Bar Charts
- Definition and Use: Bar charts provide more comprehensive information than line charts. Each bar on the chart represents a specific time period (e.g., a day, an hour), and it displays the high, low, open, and closing prices for that period. The top of the bar represents the highest price, the bottom represents the lowest price, the left dash represents the opening price, and the right dash represents the closing price.
- Real-life example: Consider monitoring the price of a cryptocurrency over the past 24 hours. Using a bar chart, you can quickly identify the highest and lowest prices during that time, as well as the opening and closing prices. This information can help you understand the market volatility and potential trading opportunities.
- Pros and Cons:
- Pros:
- More detailed than line charts, providing high, low, open, and close prices.
- Useful for analyzing market volatility and price gaps.
- Can be combined with other indicators for advanced analysis.
- Cons:
- May look overwhelming to inexperienced traders.
- Not as visually intuitive as line charts for identifying trends.
- Requires some familiarity to interpret the different components of the bars.
C. Candlestick Charts
- Definition and Use: Candlestick charts are another popular charting method that originated in Japan. Similar to bar charts, each candlestick represents a specific time period and includes the high, low, open, and closing prices. The body of the candlestick is filled or hollow, and its color (green or red) depends on whether the closing price is higher or lower than the opening price.
- Real-life example: Suppose you are analyzing the price movements of a forex currency pair over a day. With candlestick charts, you can easily see whether the currency pair closed higher (green candlestick) or lower (red candlestick) than it opened. This visual representation helps you quickly grasp the market sentiment for that day.
- Pros and Cons:
- Pros:
- Provides the same information as bar charts with an intuitive visual representation.
- Easy to identify bullish and bearish trends.
- Widely used and favored by traders for its effectiveness.
- Cons:
- Candlestick patterns can be complex to learn for beginners.
- Requires understanding of various candlestick patterns for accurate analysis.
- May not be suitable for traders who prefer minimalist charting.
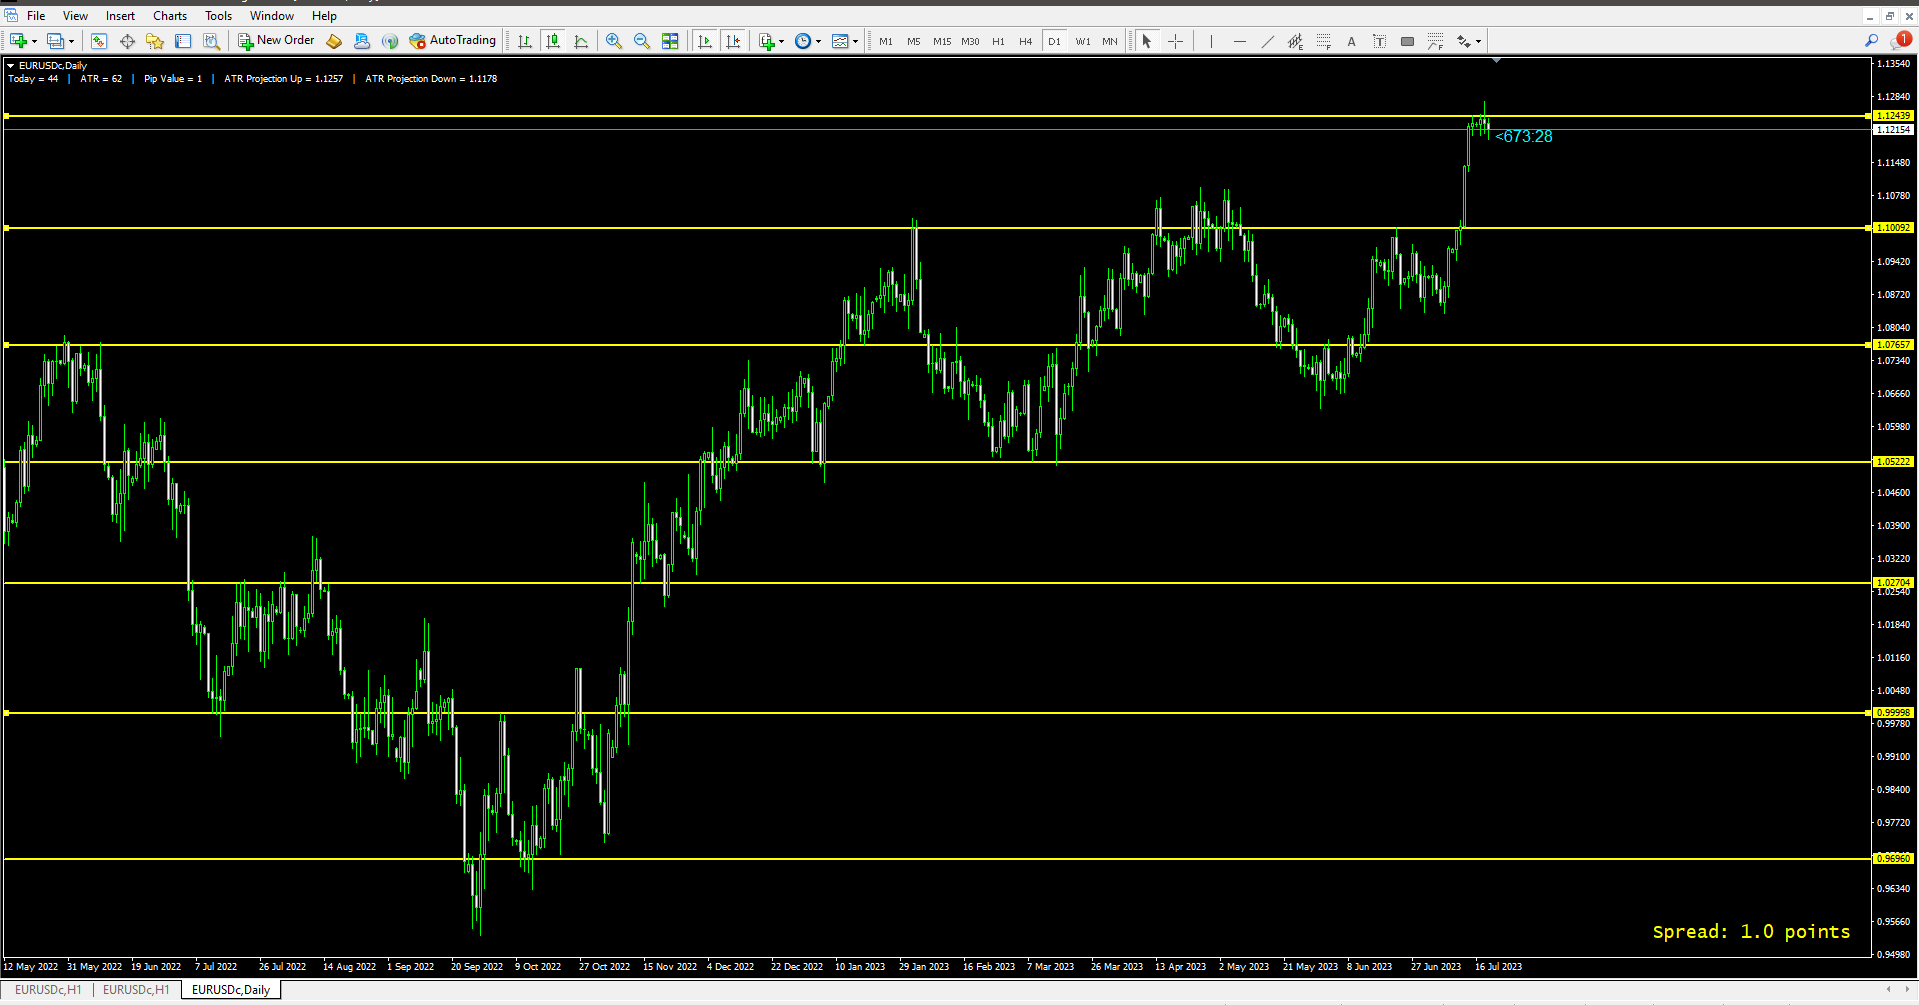
Understanding Support and Resistance Levels
CL3. What is fundamental analysis in Forex trading?
A. Definition and Importance of Support and Resistance
Support and resistance levels are essential concepts in technical analysis, representing price levels where a financial instrument’s movement tends to halt, reverse, or experience significant buying or selling pressure. Support acts as a price floor, preventing the asset’s price from falling further. On the other hand, resistance acts as a price ceiling, limiting the asset’s upward movement.
Real-life example: Picture a scenario where a popular cryptocurrency’s price has been steadily rising for some time, reaching $10,000. At this level, many traders are hesitant to buy at higher prices, causing resistance. Conversely, as the price drops to $9,000, more traders see it as an attractive opportunity to buy, leading to support.
Understanding support and resistance levels is crucial because they provide valuable insights into market sentiment and potential turning points. As a trader, you can use these levels to make informed decisions, such as identifying entry and exit points for your trades and managing risk effectively.
B. Identifying Support and Resistance on Charts
Identifying support and resistance levels on charts requires careful observation of price movements over time. Support levels are usually found at the bottom of price declines, where the price has historically struggled to fall below. Resistance levels, on the other hand, are often located at the peaks of price increases, where the price has previously faced difficulty breaking above.
Real-life example: Let’s say you are analyzing a stock’s price chart over several months. You notice that every time the stock’s price reached $50, it reversed its direction and went back up. This indicates that $50 is a strong resistance level. Similarly, you observe that the stock’s price consistently bounced back from $40, indicating a strong support level at $40.
Traders often use various technical tools like trendlines, moving averages, and chart patterns to help identify support and resistance levels with greater accuracy.
C. How to Use Support and Resistance in Forex Trading
Support and resistance levels can significantly aid traders in making profitable forex trading decisions. When the price approaches a support level, it may present a buying opportunity, as there is a higher probability of the price rebounding from that level. Conversely, when the price nears a resistance level, it could be an opportunity to sell, as the price might struggle to break above it.
Real-life example: Suppose you are trading a currency pair, and you notice that every time it reaches the support level of 1.3000, it bounces back up. Based on this observation, you decide to enter a long position (buy) when the price approaches 1.3000, expecting it to rise again. Similarly, when the currency pair approaches the resistance level of 1.3500, you might consider exiting your position or entering a short position (sell) since it has historically faced difficulty moving above that level.
However, it’s essential to combine support and resistance analysis with other technical indicators and risk management strategies to make well-informed trading decisions. Market conditions can change rapidly, so staying updated and adapting your approach accordingly is crucial for successful forex trading.
Fractal_Support_Resistance_Indicator:
[lockercat] Download Fractal_Support_Resistance_Indicator from google drive [/lockercat]
The Fractal Support Resistance indicator is a very helpful indicator for beginners to pro traders. This custom indicator saves a lot of time and drow the Support and Resistance line for all time frames from H1 to W1. Each line has a different color and it will readjust when the market makes the next move or create a new support or resistance level.
Frequently Asked Questions
Q1: What is technical analysis, and why is it essential in forex trading?
- Technical analysis is a method used by traders to predict future price movements in the forex market based on past price data. It’s crucial in forex trading as it helps traders identify trends, entry, and exit points, and potential market reversals. By studying historical price patterns, technical analysis allows traders to make informed decisions and gain insights into market sentiment.
Q2: What are the key principles and assumptions of technical analysis?
- The key principles of technical analysis include “price discounts everything,” implying that all relevant information is reflected in the price, and “history repeats itself,” suggesting that past price patterns tend to recur. Assumptions include the use of charts to visualize price data and the belief that price movements follow trends.
Q3: What are the three types of charts used in technical analysis?
- The three types of charts are line charts, bar charts, and candlestick charts. Line charts show the closing prices over a period, bar charts display the high, low, open, and close prices for each period, and candlestick charts provide a visual representation of price movements using candlestick shapes.
Q4: What is the significance of support and resistance levels in technical analysis?
- Support and resistance levels are crucial in technical analysis as they indicate price levels where an asset’s movement tends to stall or reverse. Support acts as a price floor, preventing further price declines, while resistance acts as a price ceiling, limiting upward movement. Traders use these levels to identify potential entry and exit points and gauge market sentiment.
Conclusion
In conclusion, Forex Class 4: Technical Analysis – Part 1 has provided three types of charts used for analyzing price movements: line charts, bar charts, and candlestick charts, each offering unique insights into market trends. we learned about the critical concept of support and resistance levels, which act as key indicators of potential price reversals and market sentiment. Armed with this knowledge, traders are better equipped to navigate the dynamic world of forex trading and make more informed decisions based on technical analysis. As we progress to the next part of our Forex Class, we look forward to exploring advanced technical analysis techniques and further enhancing our trading skills.
Do you need a Deep Road Map for Forex learning? Structural Forex Trading Learning Road Map
Your opinions and insights are invaluable to us! We invite you to share your thoughts, experiences, and questions related to our Forex Class on Technical Analysis – Part 1. We believe that an engaging discussion fosters a deeper understanding of the subject matter and enriches the learning experience for everyone. Whether you have tips to share, success stories to inspire, or even challenges you’d like to overcome together, your participation is highly encouraged. Let’s build a thriving community of forex enthusiasts where we can learn from each other and grow as traders. Please feel free to leave your comments below and let’s embark on this educational journey together!