Technical analysis is a fundamental aspect of successful Forex trading. Among the various tools available, trendlines and channels play a crucial role in identifying potential price movements and making informed trading decisions. In this blog post, we will explore seven essential tips for effectively using trendlines and channels in Forex trading strategies.
Understanding Trendlines
Which Forex broker is reliable for Forex trading and has less spread and instant withdrawal?
Trendlines are straight lines drawn on a price chart to connect consecutive higher lows in an uptrend or lower highs in a downtrend. They provide valuable insights into the market’s direction and can be powerful indicators for traders. When drawing trendlines, remember to use the “line of best fit” technique to ensure that the line touches as many data points as possible without violating the overall trend.
For instance, consider the USD/EUR currency pair, which has been in an uptrend for the past few weeks. Drawing an upward trendline connecting the consecutive higher lows will help you identify potential entry points in line with the prevailing uptrend.
Types of Trendlines
What is fundamental analysis in Forex trading?
Trendlines come in different forms, each offering unique information about the market. Upward trendlines indicate bullish trends, downward trendlines suggest bearish trends, and horizontal trendlines signify consolidation phases or potential trend reversals. Understanding these distinctions will help you interpret price movements more effectively.
Utilizing Trendlines for Support and Resistance Levels
Trendlines can also act as support and resistance levels. In an uptrend, the upward trendline serves as a dynamic support level, while in a downtrend, the downward trendline acts as a dynamic resistance level. These levels can help you identify potential price reversal points and plan your trades accordingly.
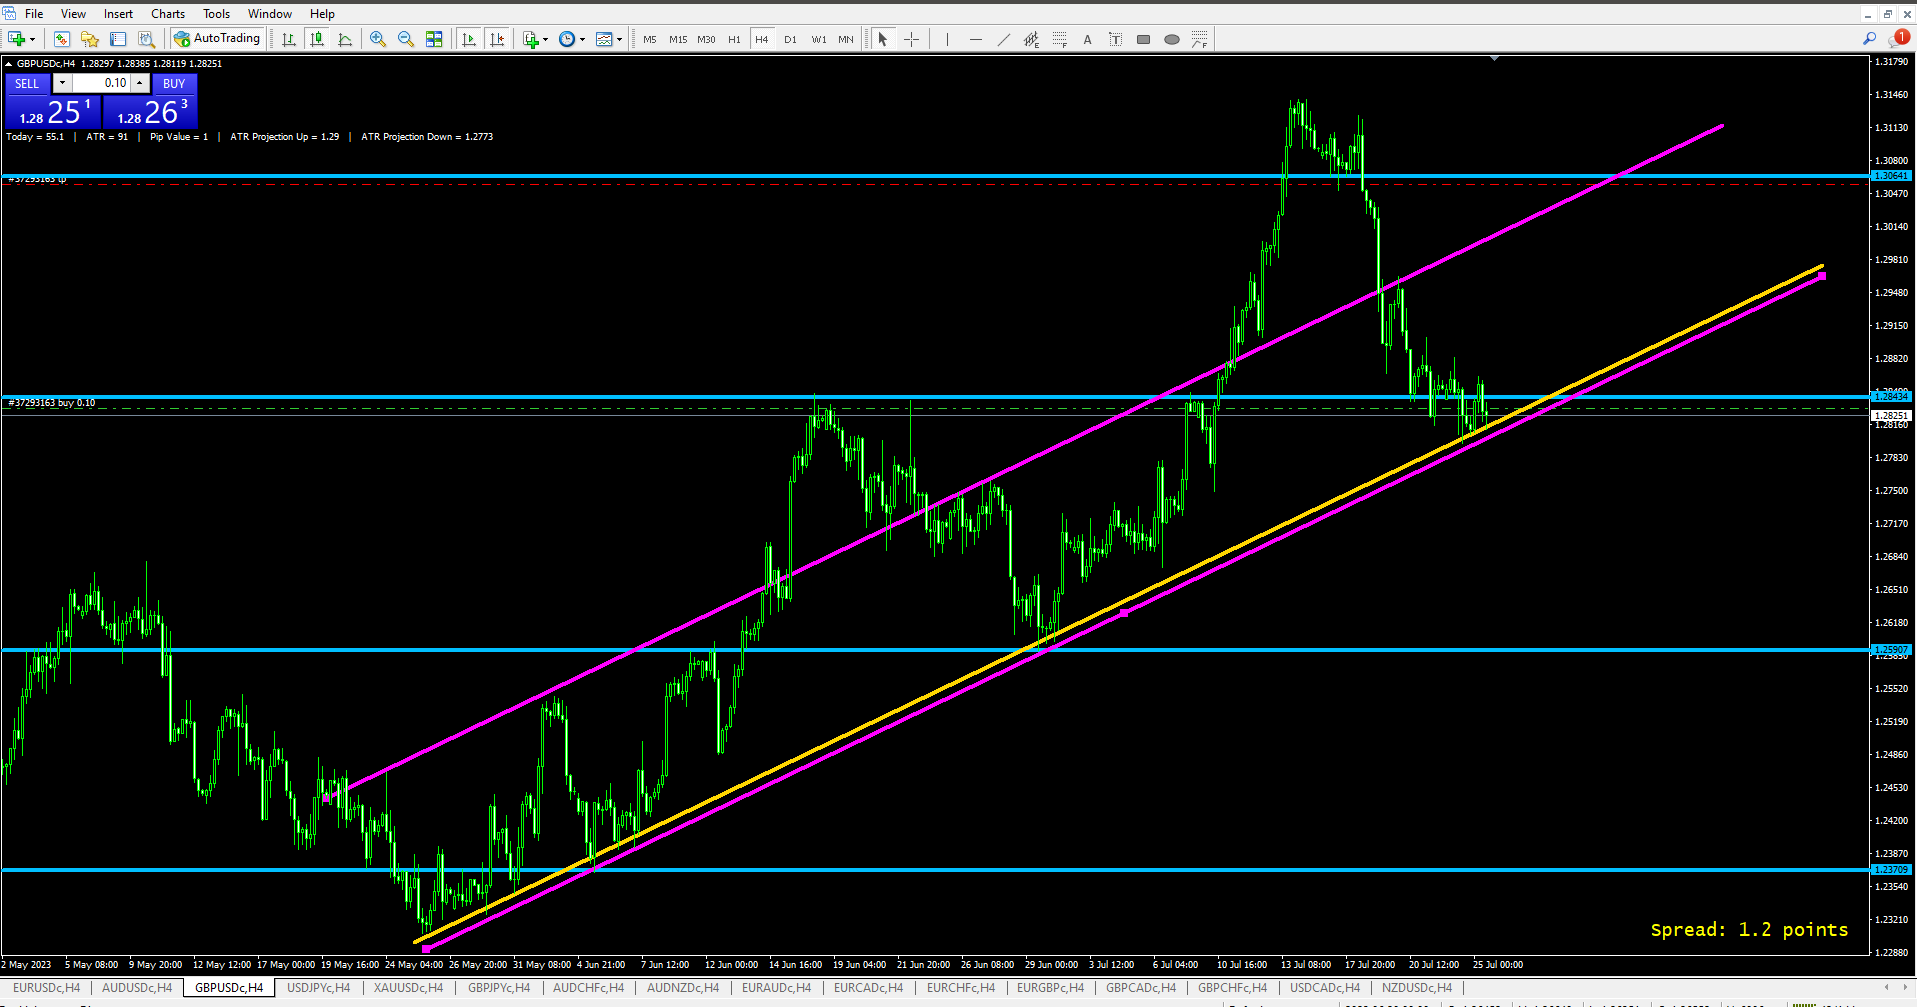
For example, suppose you notice a significant upward trendline acting as support on the GBP/USD chart. If the price approaches this trendline, it might present a favorable buying opportunity as historical data suggests a higher probability of the price bouncing back from this level.
Channel Patterns Explained
Channels are price patterns formed by drawing parallel trendlines to connect the highs and lows of a price movement. They help traders identify areas of price containment and forecast potential breakout or breakdown points.
Drawing Channels Properly
What are Support Resistance and Chart types in Forex trading?
To draw channels accurately, identify at least two consecutive highs and lows and draw parallel lines connecting them. These channels can be ascending, descending, or horizontal, depending on the market’s prevailing trend. Keep in mind that price rarely stays within the channel forever, so be prepared for potential breakouts or breakdowns.
Spotting Breakouts and Breakdowns
Breakouts and breakdowns occur when the price moves beyond the boundaries of a channel, indicating a potential trend reversal or continuation. These events offer excellent trading opportunities for traders who can capitalize on them.
Suppose you observe a price breakout above an ascending channel on the AUD/JPY chart. This might suggest the start of a new bullish trend, giving you a chance to enter a long position and ride the upward movement.
Combining Trendlines and Channels
How to Identify Support and Resistance Levels in Technical Analysis?
The most powerful insights come from combining trendlines and channels. When both tools confirm the same price levels or direction, it enhances the probability of a successful trade. This confluence can act as a strong signal for traders to enter or exit positions.
For instance, if an upward trendline and a descending channel indicate a potential resistance level near the same price area on the EUR/GBP chart, it strengthens the signal, increasing your confidence in your trading decision.
Examples and Case Studies
To reinforce your understanding, let’s look at a real-life example. In the USD/CAD currency pair, a descending channel has been forming for several months. Suppose you identify a breakdown below the lower channel boundary, suggesting a potential trend reversal. Combining this with a downward trendline confirmation adds weight to the analysis, making it a compelling opportunity to enter a short position.
Risk Management Considerations
While trendlines and channels provide valuable insights, risk management remains crucial in Forex trading. Set appropriate stop-loss and take-profit levels based on your analysis to protect your capital and maximize potential gains.
Frequently Asked Questions
What are Forex chart patterns and why it is essential?
1. Q: How do I draw an accurate trendline in Forex trading?
- To draw an accurate trendline, identify at least two consecutive higher lows for an uptrend or lower highs for a downtrend. Use the “line of best fit” technique, ensuring the trendline touches as many data points as possible without violating the overall trend. This will provide a clearer picture of the market direction and potential entry points for your trades.
2. Q: What is the significance of channel patterns in Forex trading?
- Channel patterns are formed by drawing parallel lines connecting consecutive highs and lows in a price movement. They help traders identify areas of price containment and forecast potential breakout or breakdown points. Channels assist in understanding price trends and can be valuable indicators for planning entry and exit points in trades.
3. Q: How can I use trendlines and channels together effectively?
- Combining trendlines and channels enhances trading analysis. When both tools confirm the same price levels or direction, it strengthens the probability of a successful trade. This confluence acts as a strong signal for traders to enter or exit positions with increased confidence.
4. Q: What are the breakout and breakdown points in Forex trading?
- Breakouts occur when the price moves above a resistance level or below a support level, signaling a potential trend continuation or reversal. Conversely, breakdowns happen when the price moves below a support level or above a resistance level, indicating a potential change in market direction. Traders can capitalize on these events for profitable trading opportunities.
5. Q: Why is risk management crucial in Forex trading?
- Risk management is vital as it helps protect your capital and control potential losses. Setting appropriate stop-loss and take-profit levels based on your analysis ensures you exit trades at predetermined points, safeguarding your funds from adverse market movements. Proper risk management allows traders to stay disciplined and trade with a long-term perspective, improving overall trading performance.
Conclusion of Trendlines and Channels in Forex Trading
Trendlines and channels are invaluable tools in Forex trading. By understanding their types, drawing them accurately, and combining their analysis, you can make more informed decisions and improve your trading performance. Remember to practice, analyze historical data, and manage risk effectively to enhance your overall trading success. Happy trading!
Do you need a Deep Road Map for Forex learning? Structural Forex Trading Learning Road Map
Your input and insights are essential to us! We invite you to share your thoughts, experiences, and questions related to our recent blog post on “7 Essential Tips for Trendlines and Channels in Forex Trading.” Whether you have additional tips to offer, real-life examples to share, or if you seek clarification on any aspect of the topic, we’d love to hear from you. Your comments not only help us understand your needs better but also foster a vibrant community of traders who can learn from each other. So, please take a moment to leave a comment below and join the discussion. We look forward to engaging with you and building a stronger, more knowledgeable Forex trading community together!