In the dynamic world of forex trading, mastering the art of technical analysis can significantly enhance your trading decisions. One powerful tool that has captured the attention of traders is the Fibonacci Indicator. This tool, based on the famous Fibonacci sequence, holds immense potential when used as support and resistance levels. In this article, we will delve into the five key strategies that can help you harness the power of the Fibonacci Indicator for better trading outcomes.
Understanding the Fibonacci Indicator
Which Forex broker is reliable for Forex trading and has less spread and instant withdrawal?
Before we delve into strategies, let’s grasp the basics of the Fibonacci Indicator. Derived from the ancient Fibonacci sequence, this tool employs key ratios like 38.2%, 50%, and 61.8% to identify potential support and resistance levels on a price chart. These levels are calculated based on the preceding price movement, helping traders anticipate potential turning points in the market.
Utilizing Fibonacci as Support and Resistance
In the realm of forex trading, support and resistance are fundamental concepts. Support is where the price tends to stop falling and might even bounce back, while resistance is where the price stalls and may reverse its upward trend. Fibonacci levels often align with these support and resistance zones, making them invaluable tools for traders.
Key Strategies for Using Fibonacci as Support and Resistance
What are Forex chart patterns and why it is essential?
A. Strategy 1: Identifying Confluence Zones
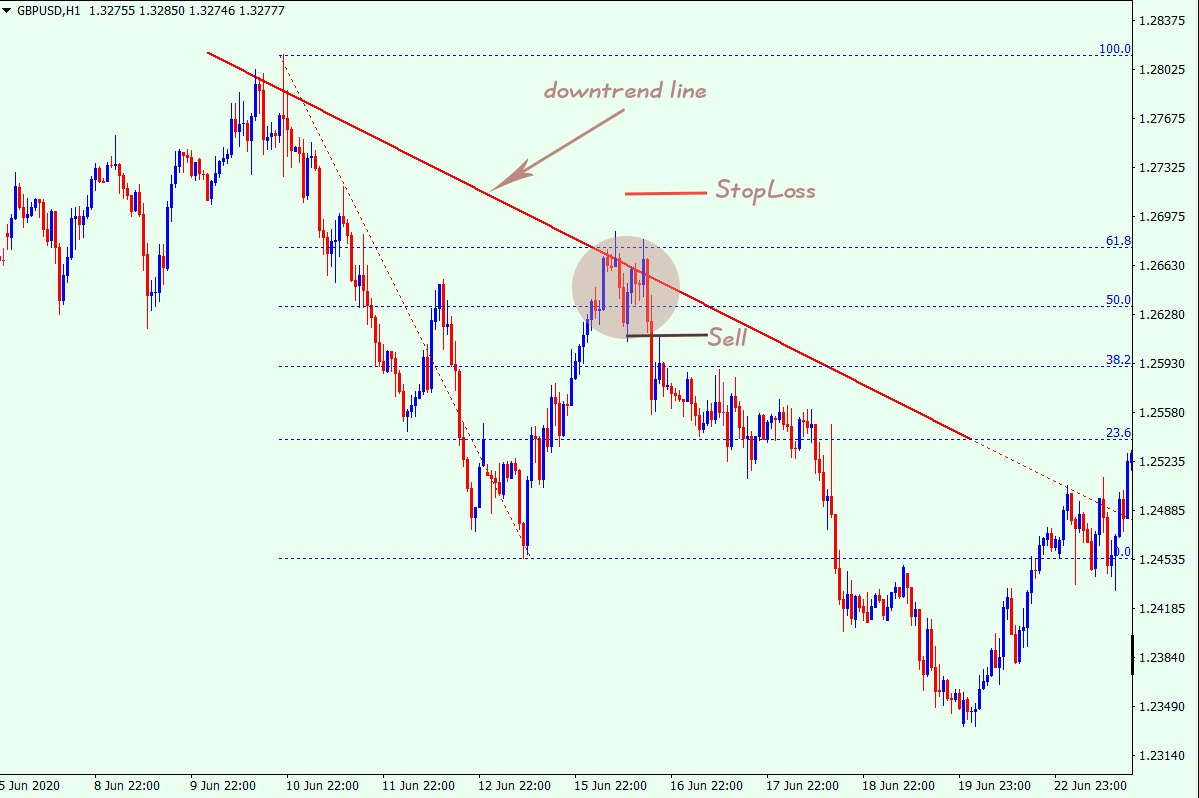
When Fibonacci levels coincide with other technical indicators like moving averages or trendlines, they create confluence zones. These areas carry stronger potential for price reversals or breakouts, providing traders with more confidence in their decisions.
For instance, if a 61.8% Fibonacci retracement aligns with a major trendline, and the Relative Strength Index (RSI) indicates overbought conditions, this confluence suggests a higher likelihood of a reversal.
B. Strategy 2: Trading the Bounce off Fibonacci Levels
One of the simplest yet effective strategies is trading the bounce. When the price approaches a Fibonacci support or resistance level and shows signs of reversal, such as a bullish engulfing candlestick pattern or bullish divergence on the RSI, traders can enter the market with a buy or sell order respectively.
Placing stop-loss orders below the Fibonacci level enhances risk management, as a breach of the level may indicate a false breakout.
C. Strategy 3: Riding the Breakout beyond Fibonacci Levels
Fibonacci levels not only act as support and resistance, but they can also help confirm breakouts. Traders can wait for a candlestick close above a major Fibonacci resistance level before entering a long position, or below a support level for a short position.
This strategy gains further strength when accompanied by a surge in trading volume, validating the breakout’s authenticity.
What are Bollinger Bands and how to use it properly?
D. Strategy 4: Fibonacci Retracement within Price Patterns
Price patterns like triangles or flags often contain hidden Fibonacci retracement levels within them. Combining pattern recognition with Fibonacci analysis increases the accuracy of potential support and resistance levels.
For example, a symmetrical triangle may have its upper trendline aligned with a 50% Fibonacci level, reinforcing its significance as a resistance zone.
E. Strategy 5: Using Multiple Timeframes for Confirmation
Analyzing Fibonacci levels across multiple timeframes provides a comprehensive view of support and resistance. While a level might appear strong on a shorter timeframe, its significance could be magnified if it also aligns on a higher timeframe.
For instance, if a 38.2% Fibonacci support level coincides with a significant moving average on both the daily and weekly charts, its importance is heightened.
Real-Life Examples of Fibonacci Support and Resistance
How are trend lines and channels used in technical analysis?
A. Example 1: Applying Fibonacci Levels in a Trending Market
Consider a strong uptrend where the price starts retracing. Applying Fibonacci retracement levels to this trend helps identify potential support zones. If the price finds support at the 61.8% Fibonacci level and displays bullish candlestick patterns, traders might confidently anticipate a resumption of the uptrend.
B. Example 2: Utilizing Fibonacci within a Ranging Market
In a ranging market, where price moves between established support and resistance boundaries, Fibonacci levels can offer valuable insights. If the price consistently respects a specific Fibonacci retracement level as resistance during range-bound movement, traders can plan short positions around that level and place stop-loss orders above it.
Risk Management and Fibonacci Trading
What are the most popular 7 Moving Average strategies?
While Fibonacci levels enhance trading decisions, effective risk management remains paramount. Determine position sizes based on the distance between your entry point and the Fibonacci level. Placing stop-loss orders just beyond these levels can help prevent significant losses in case of a reversal.
Frequently Asked Questions
1. How do I calculate Fibonacci levels in forex trading?
- To calculate Fibonacci levels, identify the high and low points of a significant price move. Then, apply the Fibonacci ratios (38.2%, 50%, and 61.8%) to this range. These levels act as potential support and resistance zones, aiding in predicting price reversals or breakouts.
2. Can I use Fibonacci levels with other technical indicators?
- Absolutely! Combining Fibonacci levels with indicators like moving averages, trendlines, or the Relative Strength Index (RSI) can amplify their effectiveness. Confluence zones, where Fibonacci aligns with other indicators, provide stronger signals for making informed trading decisions.
3. How do I manage risk when trading with Fibonacci levels?
- Effective risk management is crucial. Determine your position size based on the distance between your entry and the nearest Fibonacci level. Place stop-loss orders just beyond these levels to protect against sudden reversals, ensuring your potential losses remain within your risk tolerance.
4. Can Fibonacci levels be applied to different timeframes?
- Yes, Fibonacci levels can be applied to various timeframes. They gain significance when they align on multiple timeframes. For instance, if a Fibonacci level coincides with both the daily and weekly charts, it strengthens its role as a support or resistance zone.
5. What if the price doesn’t precisely hit a Fibonacci level?
- It’s common for prices to approximate Fibonacci levels without hitting them exactly. Traders should focus on price action signals (like candlestick patterns) around these levels for entry and exit decisions. The importance lies in how the price interacts with the vicinity of the Fibonacci level rather than hitting it precisely.
How to trade in Forex with Oscillators (RSI, MACD, Stochastic)?
Conclusion
In the realm of forex trading, the Fibonacci Indicator stands as a potent tool for identifying support and resistance levels. By applying the five key strategies outlined in this article – recognizing confluence zones, trading bounces, riding breakouts, integrating with price patterns, and using multiple timeframes – traders can unlock the true power of the Fibonacci Indicator, enhancing their ability to make informed and strategic trading decisions.
Do you need a Deep Road Map for Forex learning? Structural Forex Trading Learning Road Map
We hope you found our article on mastering Fibonacci trading with support and resistance strategies enlightening and informative. Your insights, questions, and personal experiences are invaluable to us. We invite you to share your thoughts in the comments section below. Have you successfully integrated Fibonacci levels into your trading strategy? Are there any specific challenges you’ve faced or additional tips you’d like to add? Your contributions not only enrich our community but also help fellow traders expand their knowledge and refine their skills. Let’s engage in a meaningful discussion and continue to learn and grow together in the exciting world of forex trading. Happy trading and looking forward to your comments!