Welcome to the exciting world of forex trading! Whether you’re a seasoned trader or just starting, mastering essential strategies is key to navigating the dynamic and often unpredictable forex market. In this article, we’ll delve into four crucial strategies that will empower you to make informed trading decisions: Understanding Candlestick Patterns, Exploring Chart Timeframes, Identifying and Riding Trends, and Confirming with Indicators.
Understanding Candlestick Patterns
Which Forex broker is reliable for Forex trading and has less spread and instant withdrawal?
Candlestick charts are the backbone of technical analysis in forex trading. These charts provide valuable insights into market sentiment and potential price movements. A candlestick consists of a body, wick, and shadow, each revealing different aspects of price action.
Common Candlestick Patterns:
- Bullish Patterns: The Hammer, characterized by a small body and long lower shadow, signals a potential bullish reversal. The Bullish Engulfing pattern occurs when a small bearish candle is followed by a larger bullish candle, indicating a possible uptrend reversal.
- Bearish Patterns: The Shooting Star features a small body and long upper shadow, suggesting a bearish reversal. The Bearish Engulfing pattern happens when a bullish candle is followed by a larger bearish candle, indicating a potential downtrend reversal.
Example: Imagine you spot a Bullish Engulfing pattern after a prolonged downtrend. This pattern suggests a possible trend reversal, providing you with an opportunity to enter a buy trade.
Exploring Chart Timeframes
What is fundamental analysis in Forex trading?
Chart timeframes play a vital role in forex trading, as they offer different perspectives on price movements and trends. Traders can choose from various timeframes, including minutes, hours, days, weeks, and months, based on their preferred trading style and goals.
Matching Timeframes with Trading Styles:
- Scalping: Short-term traders often use minute and hourly charts for quick trades.
- Day Trading: Hourly and daily charts help capture intraday price fluctuations.
- Swing Trading: Daily and weekly charts are suitable for identifying medium-term trends.
Example: If you’re a swing trader looking to hold positions for a few days to weeks, analyzing trends on the daily and weekly charts will provide you with a clearer picture of potential market movements.
Identifying and Riding Trends
What are Support Resistance and Chart types in Forex trading?
Spotting trends is a cornerstone of successful forex trading. Different types of trends—uptrends, downtrends, and sideways trends—offer valuable insights for traders.
Tools for Trend Identification:
- Moving Averages: These smooth out price fluctuations and highlight trend directions.
- Trendlines: Drawn along price highs or lows, trendlines help visualize trend strength.
- Support and Resistance Levels: Key price levels indicate potential trend reversals.
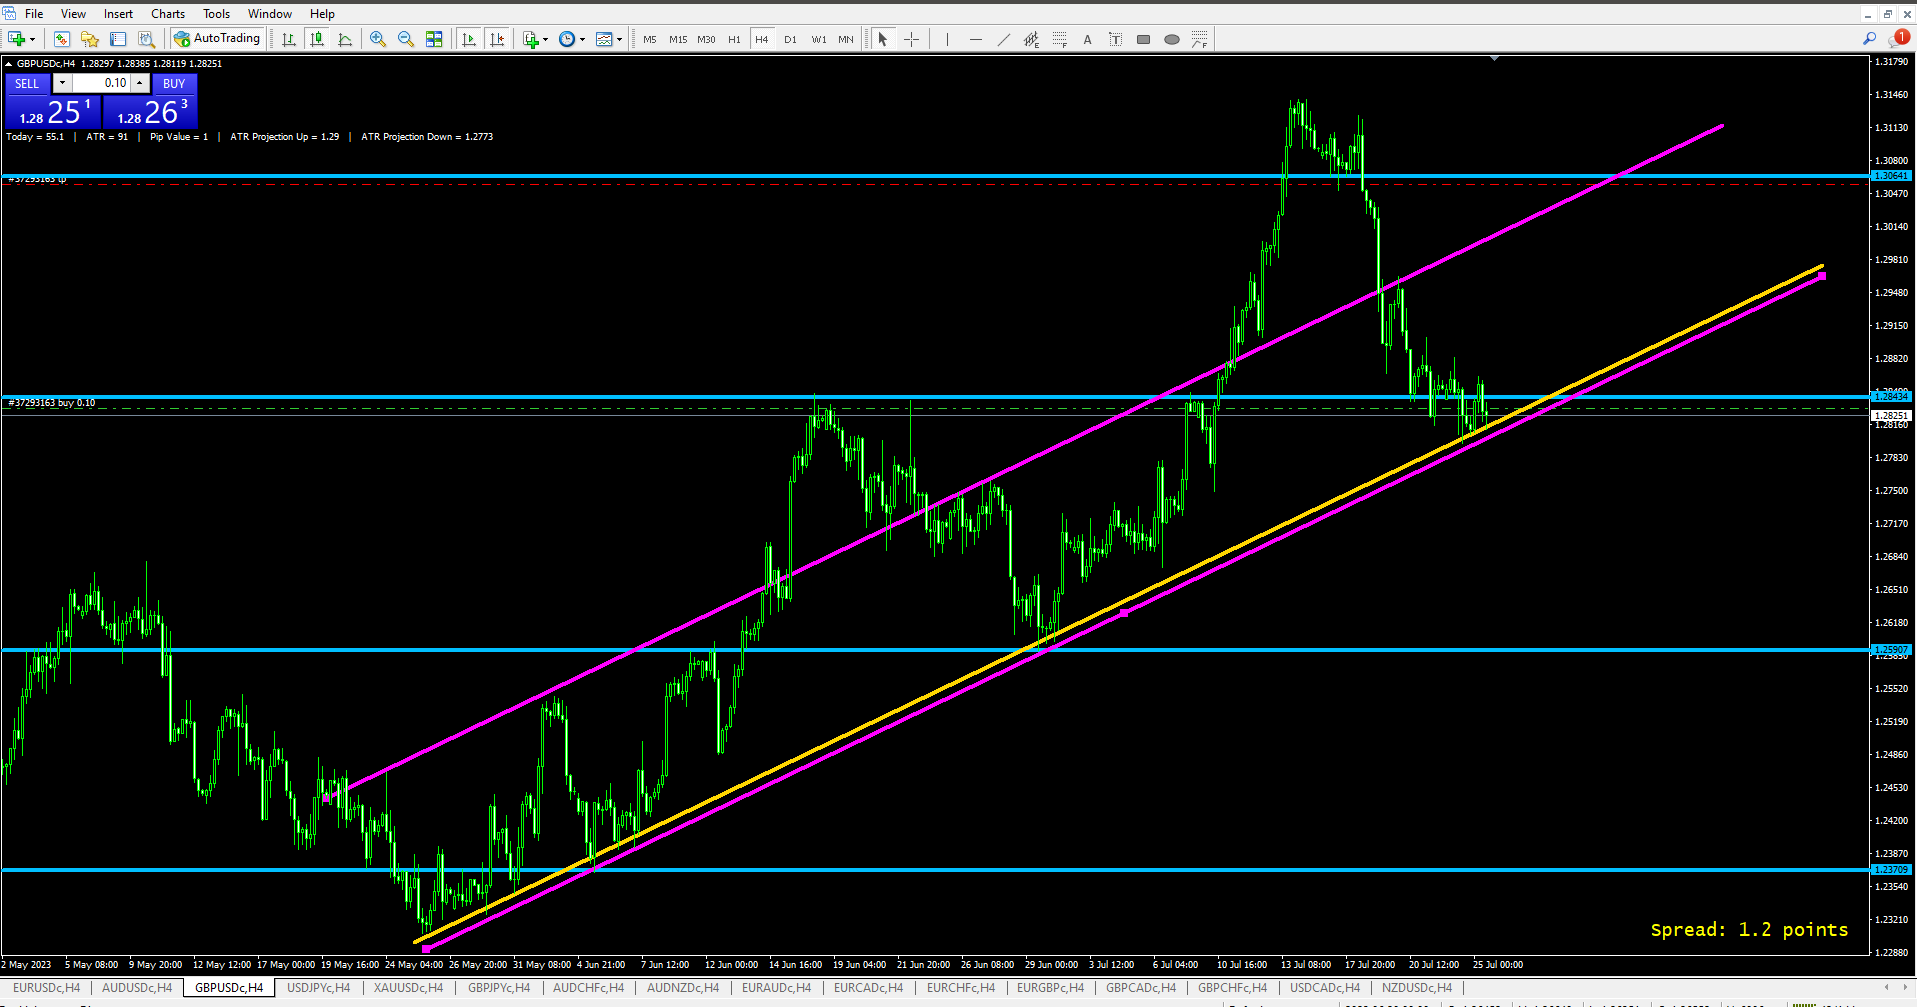
Example: By combining a rising trendline with a series of higher lows, you can confidently identify an uptrend. This insight guides you in placing strategic buy orders.
Confirming with Indicators
What is the Fibonacci indicator and how to use it as support and resistance?
Technical indicators complement your trading decisions by providing confirmation signals. Leading indicators anticipate potential price movements while lagging indicators confirm trends.
Essential Indicators for Confirmation:
- Relative Strength Index (RSI): Measures overbought or oversold conditions.
- Moving Average Convergence Divergence (MACD): Highlights potential trend shifts.
- Stochastic Oscillator: Identifies potential reversals near support or resistance.
Example: Suppose you observe a bullish candlestick pattern and a rising trendline. Confirm your analysis using the RSI, which should ideally show a move from oversold to neutral territory, supporting your decision to enter a buy trade.
Integrating Strategies for Effective Decision-Making
How to trade in Forex with Oscillators (RSI, MACD, Stochastic)?
Success in forex trading lies in integrating multiple strategies cohesively.
Comprehensive Trading Plan:
- Combine candlestick pattern recognition with trend analysis and indicator confirmation.
- Develop a risk management strategy, including setting stop-loss orders.
Example: Before entering a trade, align the signals from your candlestick pattern analysis, trend identification, and indicator confirmation. Set a stop-loss order based on your risk tolerance and trade plan.
Case Studies and Practical Examples
Let’s put these strategies to work in real-life scenarios.
Case Study 1: You identify a Bearish Engulfing pattern on the daily chart. The RSI is in overbought territory, and the MACD shows a bearish crossover. These indicators confirm the pattern, signaling a potential downtrend. You decide to enter a sell trade, and the market moves in your favor.
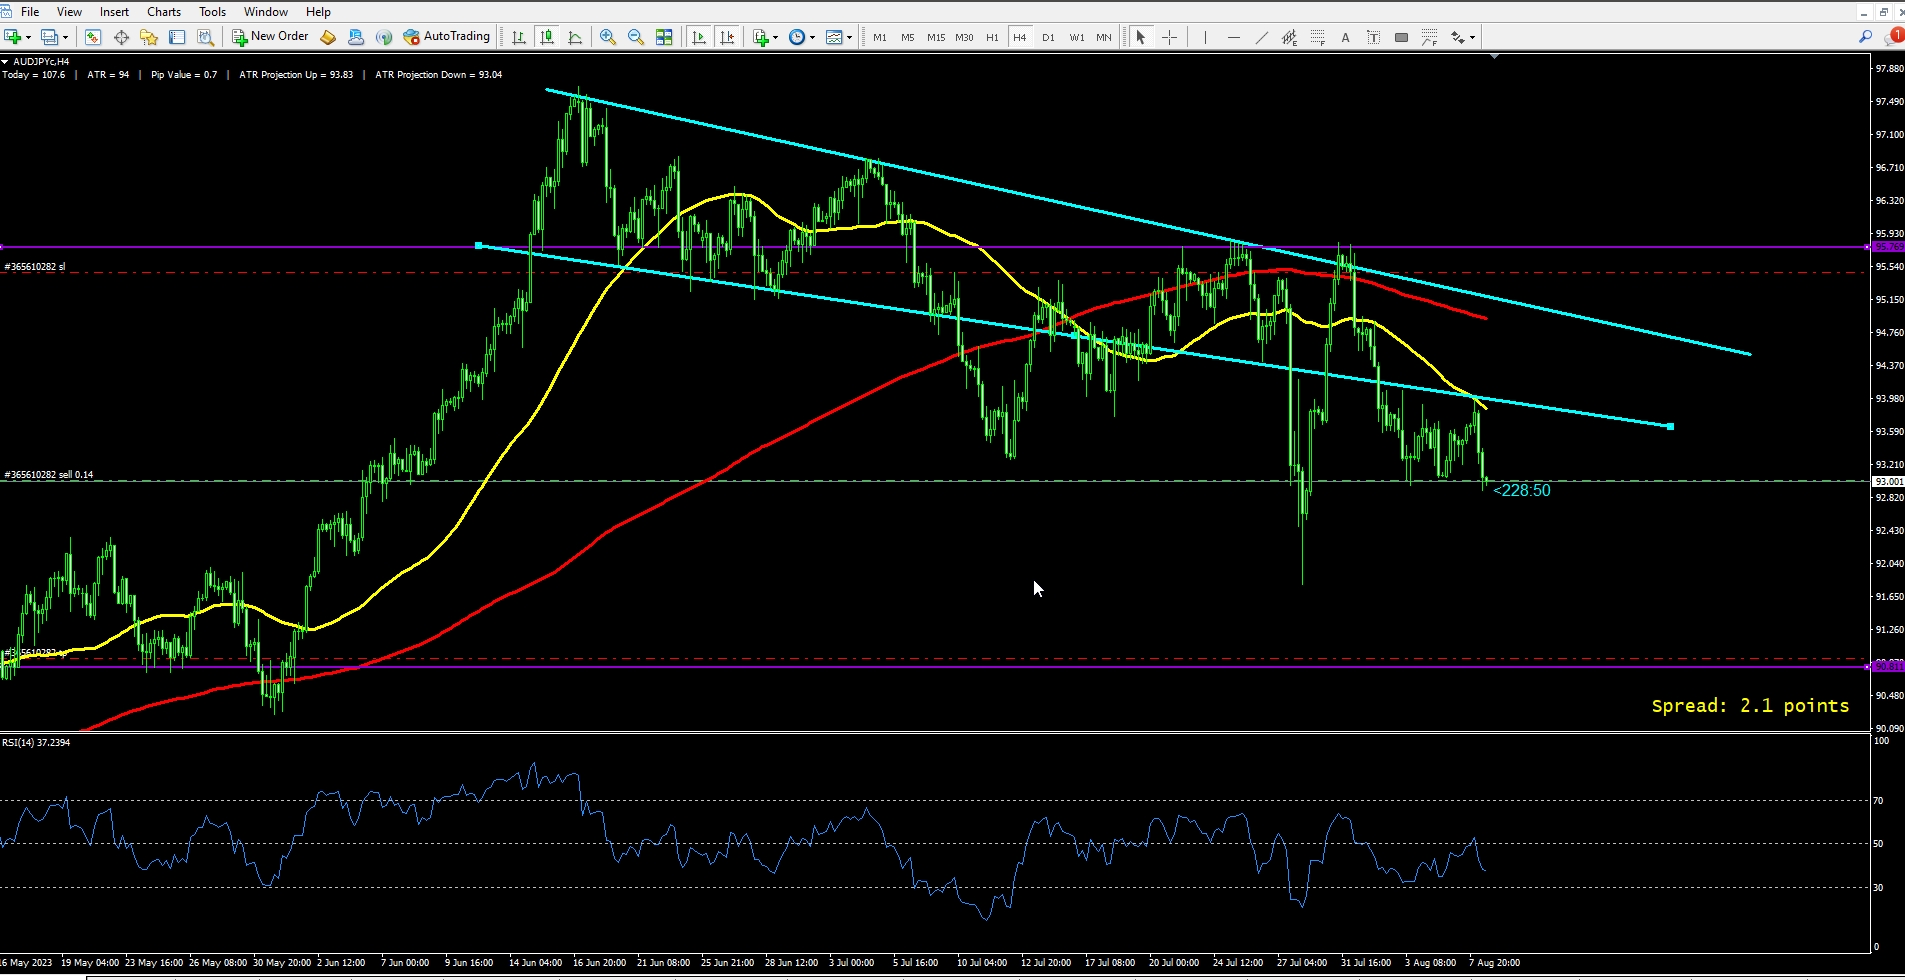
Case Study 2: After noticing a Hammer pattern near a strong support level on the 4-hour chart, you analyze the RSI, which is in oversold territory. This confirms a potential bullish reversal. You enter a buy trade and ride the subsequent uptrend.
Frequently Asked Questions
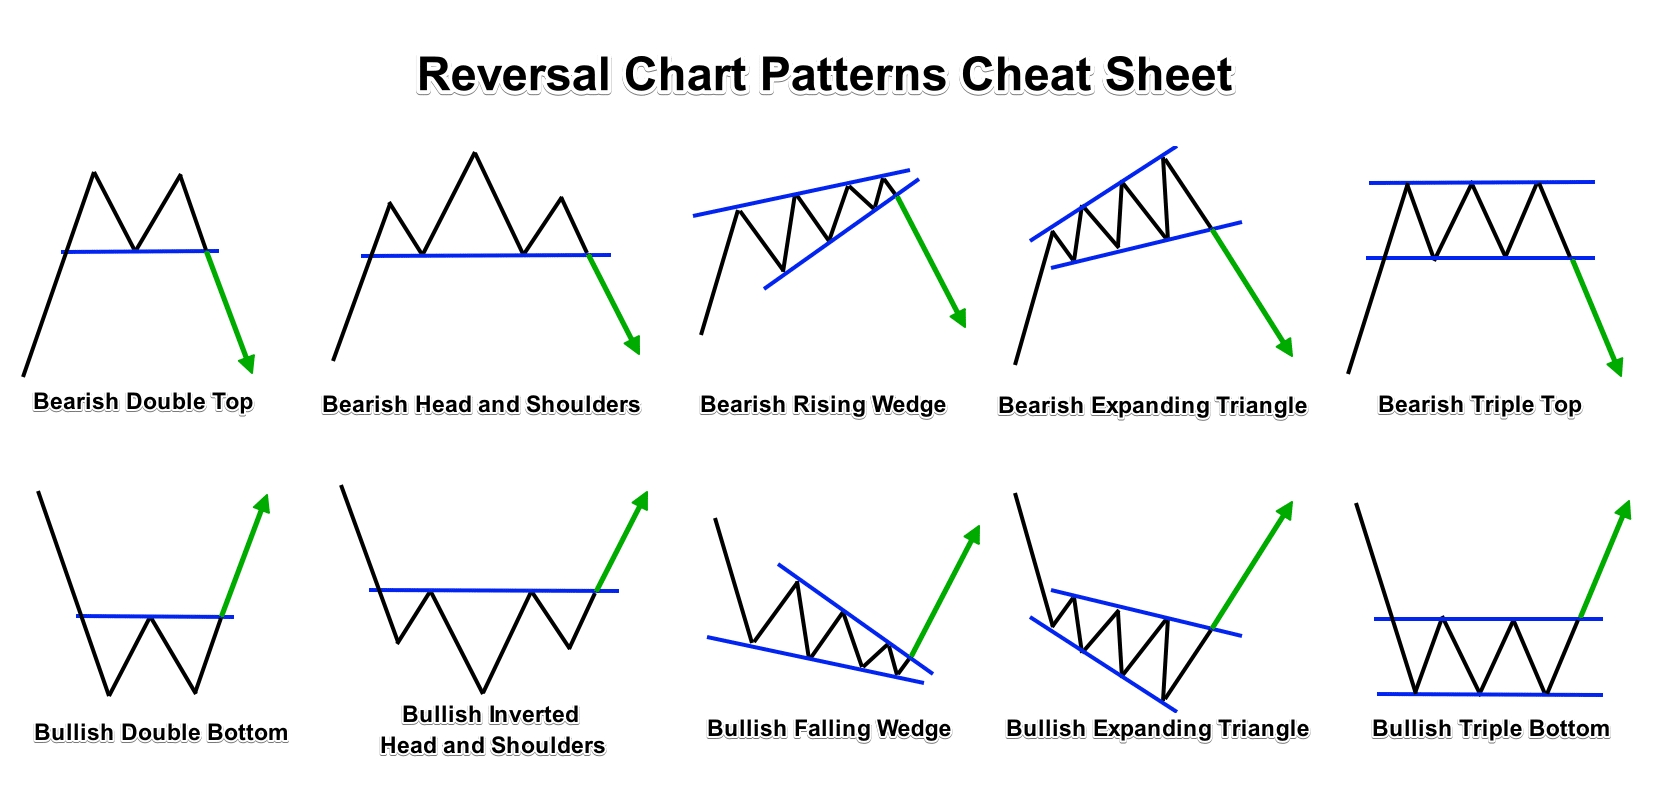
What are Forex chart patterns and why it is essential?
Q1: What is a candlestick pattern, and how can it help my forex trading?
- A candlestick pattern is a graphical representation of price movements in forex trading. It helps you gauge market sentiment and potential trend reversals. By analyzing the shape and position of candlesticks, you can make more informed trading decisions.
Q2: Which chart timeframe should I use for my trading style?
- The chart timeframe depends on your trading style. For scalping, short-term traders use minute and hourly charts. Day traders prefer hourly and daily charts, while swing traders opt for daily and weekly charts to capture medium-term trends.
Q3: How do I identify and ride trends in forex trading?
- To identify trends, use tools like moving averages, trendlines, and support/resistance levels. Combine these with price patterns to confirm trends. Riding trends involves entering trades in the direction of the established trend to maximize potential profits.
Q4: What are technical indicators, and how do they confirm trades?
- Technical indicators are mathematical calculations based on price, volume, or open interest. They confirm trades by providing additional insight into market conditions. For example, the Relative Strength Index (RSI) indicates overbought or oversold conditions, helping confirm potential reversals.
Q5: How can I integrate multiple strategies for successful forex trading?
- Integrating strategies involves aligning various indicators, patterns, and analysis techniques. Combine candlestick patterns with trend identification and confirm using indicators like MACD and RSI. Develop a comprehensive trading plan that includes risk management and stop-loss orders to make well-informed and strategic decisions.
Conclusion of Forex Trading Success with 4 Essential Strategies
Mastering forex trading requires a combination of skill, knowledge, and practice. By understanding candlestick patterns, exploring various chart timeframes, identifying trends, and confirming with indicators, you equip yourself with a powerful toolkit for successful trading. Remember, continuous learning and disciplined execution are key to honing your trading prowess. Start applying these strategies and embark on your journey toward forex trading mastery.
Do you need a Deep Road Map for Forex learning? Structural Forex Trading Learning Road Map
I invite you, dear readers, to share your thoughts and experiences in the fascinating realm of forex trading. Whether you’re a seasoned trader with valuable insights to contribute or someone taking your first steps in this dynamic market, your comments are a valuable addition to the conversation. Have you successfully applied the strategies discussed in the article? Do you have additional tips or personal anecdotes to share? Your comments not only enrich our understanding but also foster a supportive community of traders eager to learn and grow together. Join in by leaving your thoughts below – your input could inspire and empower fellow traders on their journey to mastering forex trading.