Welcome to the world of Forex trading, where precision and insight can make all the difference. In this post, we’ll delve into four Forex advanced technical indicators that can elevate your trading game. These indicators aren’t just tools; they are your keys to understanding market dynamics and making informed decisions.
Article Summary
Forex trading requires precision and insight, and advanced technical indicators can significantly enhance your decision-making process. This post explores four key indicators: Fibonacci retracements and extensions, pivot points, volume analysis, and oscillators.
Fibonacci retracements help identify potential support and resistance levels based on mathematical ratios, aiding traders in pinpointing optimal entry points. Fibonacci extensions project future price levels,
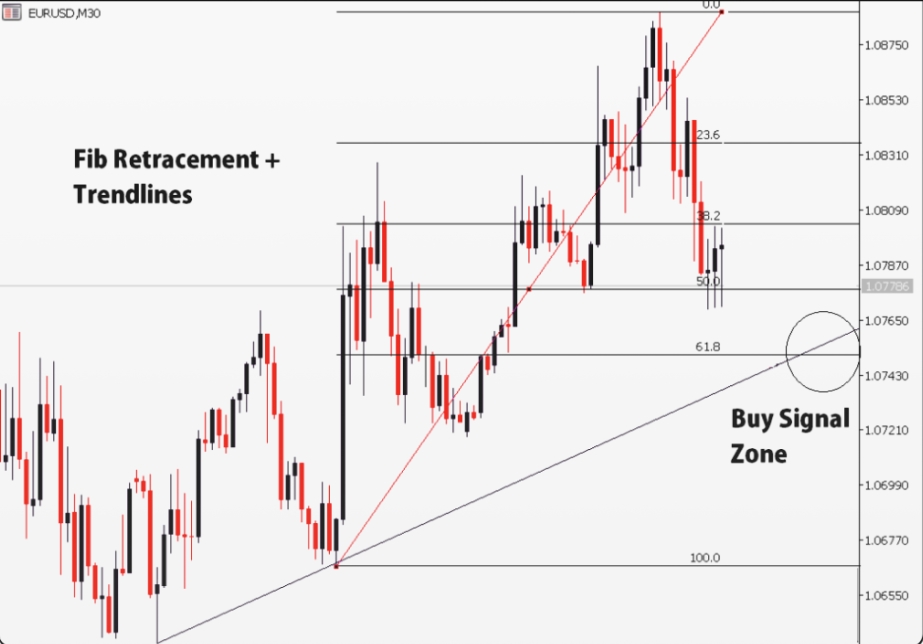
Fibonacci Retracements and Extensions
Which Forex broker is reliable for Forex trading and has less spread and instant withdrawal?
Fibonacci Retracements?
Fibonacci retracements are mathematical ratios that help traders identify potential support and resistance levels. These levels are derived from the Fibonacci sequence and can be applied to any financial market, including Forex. For example, when a currency pair is in an uptrend and then retraces, you can use Fibonacci retracements to pinpoint where the retracement may end, allowing you to enter trades at favorable levels.
Fibonacci Retracements key points
Fibonacci retracements are essential tools in technical analysis, helping traders identify potential support and resistance levels in financial markets. Derived from the Fibonacci sequence, these key levels act as price zones where reversals or corrections may occur. Common retracement levels include 38.2%, 50%, and 61.8%. Traders use Fibonacci retracements to make informed decisions, such as entering trades at favorable levels during an uptrend or considering potential reversals during a downtrend. By incorporating these levels into their analysis, traders gain valuable insights into market dynamics and enhance their trading strategies.
Fibonacci Extensions
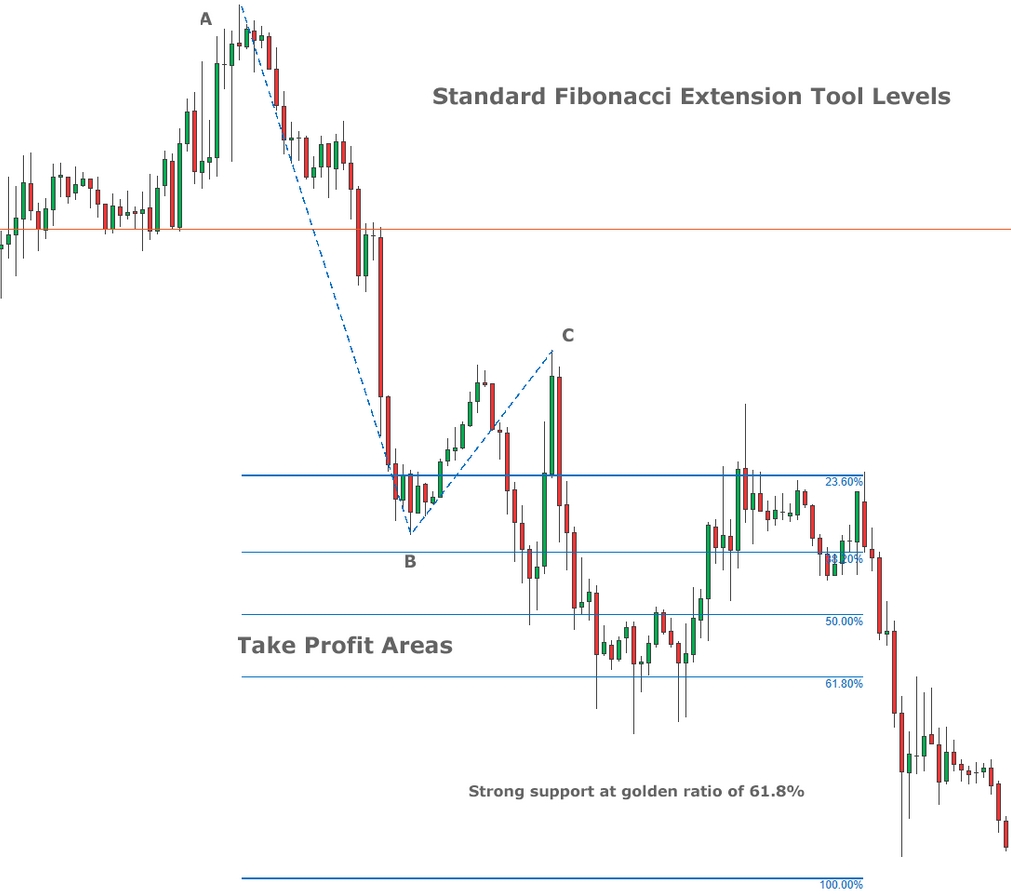
Fibonacci extensions, on the other hand, help traders set profit targets. They project potential future price levels based on the initial price swing. For instance, if a currency pair is in an uptrend and you want to identify where it might find resistance during its upward move, Fibonacci extensions can be immensely helpful.
Fibonacci in Forex Trading Practical Examples
Let’s say you’re trading the EUR/USD pair, and it’s in an uptrend. By applying Fibonacci retracement levels to the recent swing low and high, you identify potential support levels where you can consider buying. Similarly, Fibonacci extensions can help you identify potential exit points for your trade.
What is the Fibonacci indicator and how to use it as support and resistance?
- Tips for Effective Use
- Combine Fibonacci levels with other technical indicators for confirmation.
- Practice drawing Fibonacci levels on historical charts to refine your skills.
- Use the indicator as part of a comprehensive trading strategy.
Pivot Points and Their Applications
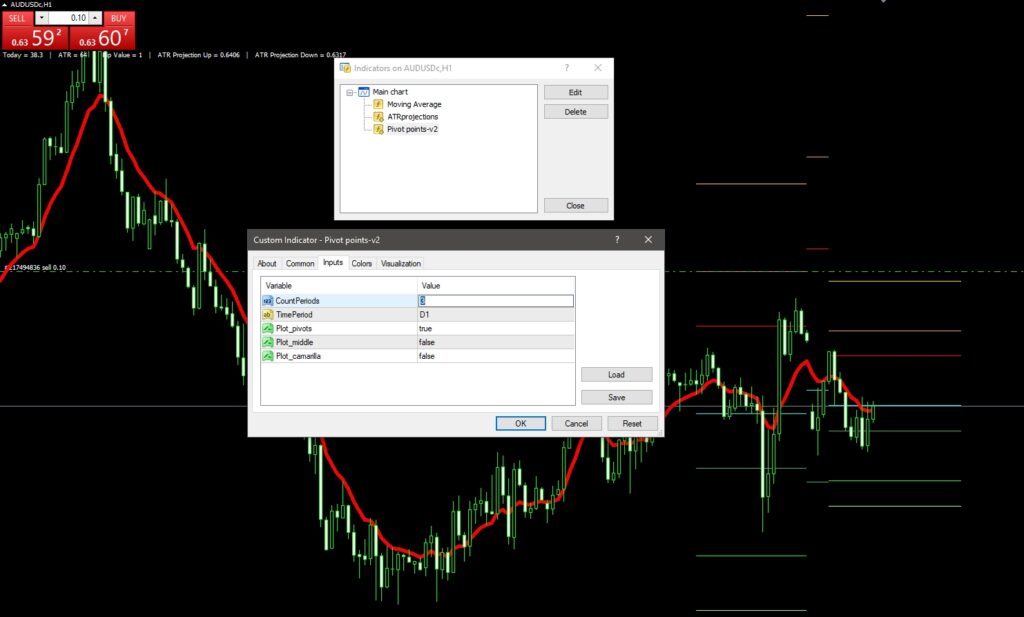
Download MT4 and MT5 Auto Pivot Points
[lockercat] Download MT4 and MT5 Auto Pivot Points [/lockercat]
Calculating Pivot Points
Pivot points are levels that can help traders identify potential reversals or breakouts. There are several methods to calculate pivot points, with the most common being the Standard Pivot, Camarilla Pivot, and Fibonacci Pivot. These points provide a framework for understanding price action.
Types of Pivot Points
In Forex, traders often focus on the Standard Pivot Points. These include the central pivot point, support levels (S1, S2, S3), and resistance levels (R1, R2, R3). By analyzing price behavior around these levels, traders can make informed decisions.
Pivot Points in Forex Trading Strategies
For instance, if the EUR/USD is trading near the central pivot point and shows signs of bullish momentum, you might consider a long trade. Conversely, if it approaches a resistance level and demonstrates bearish signals, a short trade could be in order.
Real-Life Scenarios
Imagine the USD/JPY pair breaking through a resistance level on strong volume. This could signify a breakout, and pivot points can help you confirm this potential trading opportunity.
How are trend lines and channels used in technical analysis?
Volume Analysis and Its Significance
Why Volume Matters
Volume is a crucial indicator in Forex, as it helps confirm the strength or weakness of a price movement. High volume during an uptrend, for instance, suggests strong buying interest, increasing the likelihood of a sustained upward move.
Interpreting Volume Patterns
Traders often use volume analysis to confirm chart patterns. For example, if you spot a bullish reversal pattern like a double bottom and see an increase in volume during the second bottom, it adds confidence to your trade.
Applying Volume Analysis Trading Signals
Suppose you’re considering a trade on the GBP/USD pair, and you notice a bullish engulfing candlestick pattern accompanied by a surge in volume. This combination could provide a strong buy signal.
Risk Management with Volume
What is Risk Management in Forex Trading and Calculating position sizes and more?
Volume analysis can also help you manage risk. If you see decreasing volume as a trend continues, it may indicate a weakening trend, prompting you to consider exiting your position to minimize potential losses.
Advanced Oscillator Strategies
What Are Oscillators?
Oscillators are indicators that help traders identify overbought and oversold conditions in the market. They provide insights into potential trend reversals or continuations.
Popular Oscillators in Forex
Common oscillators include the Relative Strength Index (RSI), Stochastic Oscillator, and Moving Average Convergence Divergence (MACD). These tools can help traders gauge momentum and potential turning points.
Advanced Oscillator Trading Divergence Strategies
Divergence occurs when the price and oscillator indicators move in opposite directions. If you spot bullish divergence (higher lows in price but lower lows on the oscillator), it may indicate a potential reversal to the upside.
Overbought and Oversold Conditions
Oscillators also highlight overbought and oversold conditions. For example, if the RSI reaches above 70, a currency pair may be overbought, suggesting a possible pullback.
How to trade in Forex with Oscillators (RSI, MACD, Stochastic)?
Frequently Asked Questions
What are Fibonacci retracements and extensions?
- Fibonacci retracements are key levels derived from the Fibonacci sequence, helping traders identify potential support and resistance in Forex. Extensions, on the other hand, project future price levels based on the initial price swing. Traders use these tools to make informed entry and exit decisions.
How can pivot points be calculated and applied in Forex trading?
- Pivot points, including central, support, and resistance levels, can be calculated using various methods. In Forex, they assist traders in identifying potential reversals or breakouts, aiding decision-making. For instance, if a currency pair approaches a resistance level, it may be a good time to consider a short trade.
Why is volume analysis significant in Forex?
- Volume analysis in Forex helps confirm the strength of price movements. High volume during an uptrend suggests strong buying interest, increasing the likelihood of a sustained upward move. Traders also use volume to confirm chart patterns and manage risk effectively.
- What are Forex chart patterns and why are they essential?
What are advanced oscillator strategies, and how can they be used in trading?
- Oscillators, like RSI and Stochastic, help traders identify overbought and oversold conditions. Advanced strategies involve recognizing divergence (opposite moves between price and oscillator) and understanding extreme levels for potential reversals or continuations.
How can traders integrate these advanced technical indicators into a comprehensive trading strategy?
- Successful traders incorporate Fibonacci, pivot points, volume analysis, and oscillator strategies into their overall approach. They use these indicators to confirm signals, manage risk, and make well-informed decisions, enhancing their chances of success in the Forex market.
Conclusion of Forex Advanced Technical Indicators
In conclusion, mastering advanced technical indicators like Fibonacci retracements and extensions, pivot points, volume analysis, and oscillator strategies can significantly enhance your Forex trading skills. These tools provide valuable insights into market dynamics and can be integrated into comprehensive trading strategies. Remember to combine them with thorough research and risk management for the best results.
Recommended Books and Courses
- “Technical Analysis of the Financial Markets” by John J. Murphy
- Online courses on Fibonacci analysis, pivot point strategies, and oscillator trading.
Do you need a Deep Road Map for Forex learning? Structural Forex Trading Learning Road Map
We value your input! Your thoughts and insights are important to us. Please feel free to share your comments, questions, or experiences related to this article. Your feedback helps us create better content and engage in meaningful discussions. Join the conversation by leaving a comment below; we look forward to hearing from you!