[How do I use drawing tools to annotate my charts on MT4?] In the world of Forex trading, MetaTrader 4 (MT4) has become a popular platform for its robust charting capabilities. One of the key features that set MT4 apart is its extensive range of Forex drawing tools, which allow traders to annotate their charts and gain deeper insights into market trends. In this article, we will explore 10 essential drawing tools available in MT4 and how you can effectively use them to annotate your charts.
Understanding the Drawing Tools in MT4
What are the potential benefits of Forex trading?
MT4 provides a comprehensive set of drawing tools that empower traders to mark up their charts with important annotations. Let’s take a closer look at the key drawing tools available:
- Trendlines: Trendlines help identify the direction of a trend and potential support or resistance levels. By drawing a trendline connecting higher lows in an uptrend or lower highs in a downtrend, you can gain valuable insights into market momentum.
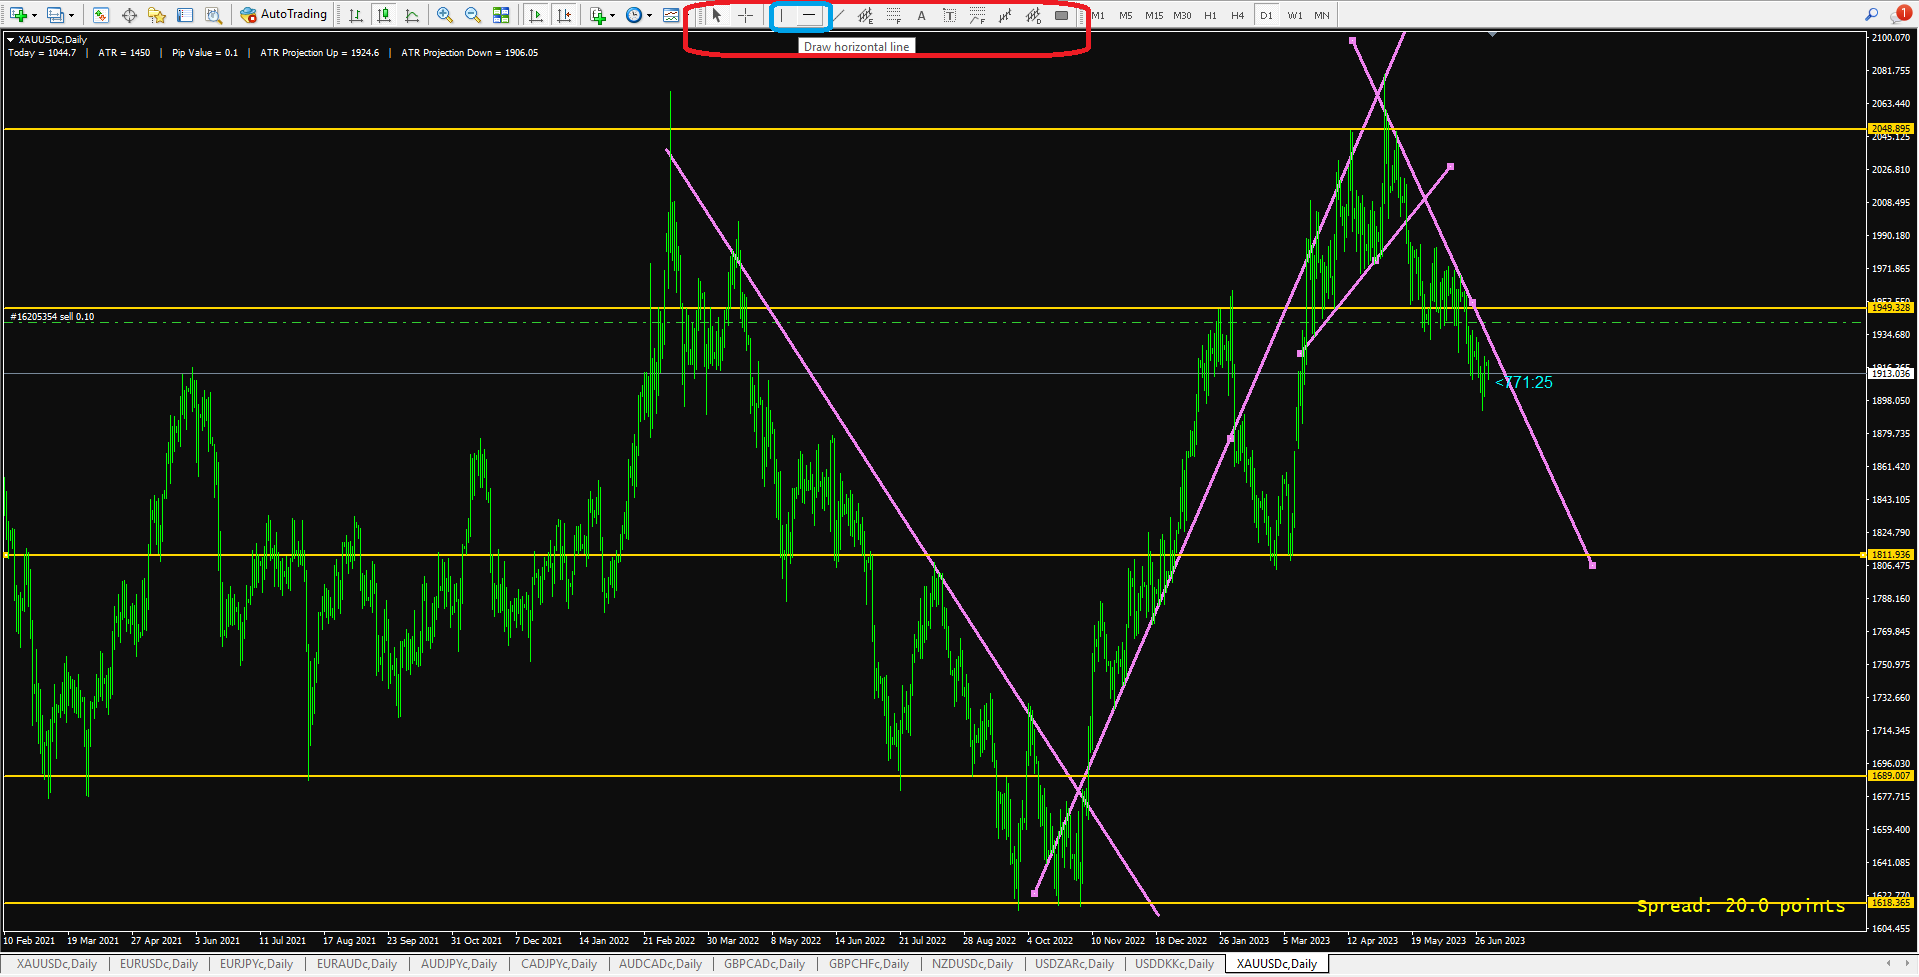
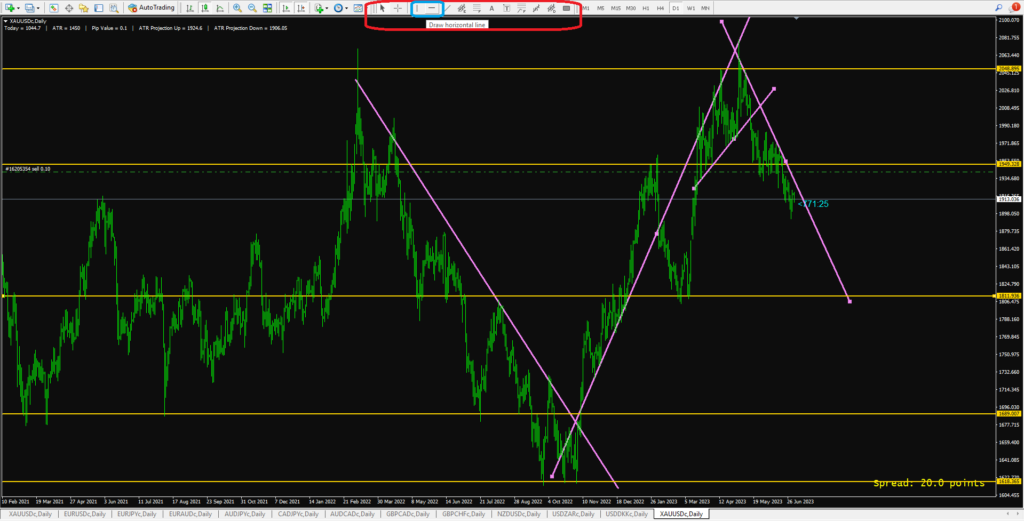
- Horizontal and Vertical Lines: Horizontal and vertical lines are useful for marking specific price levels or key areas of interest on the chart. You can use them to highlight support and resistance zones or important psychological levels.
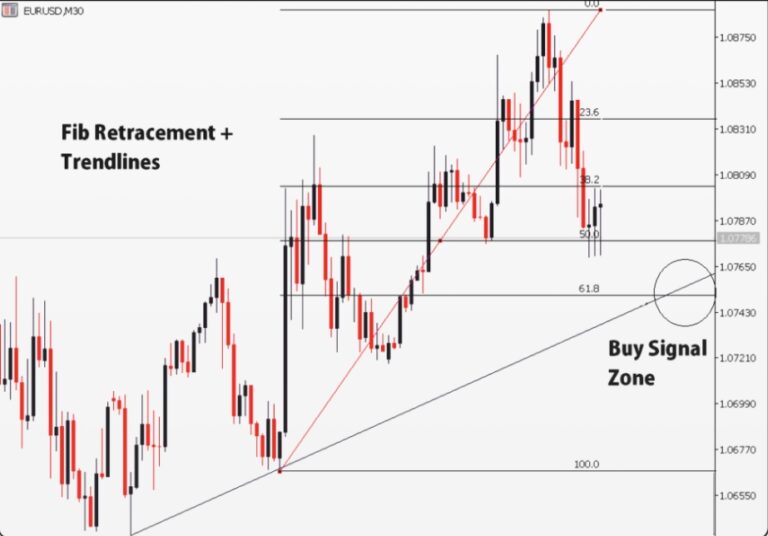
- Fibonacci Retracement: Fibonacci retracement is a powerful tool for identifying potential retracement levels within a trend. By drawing Fibonacci levels from a swing high to a swing low (or vice versa), you can anticipate potential areas where the price may retrace before continuing its trend.
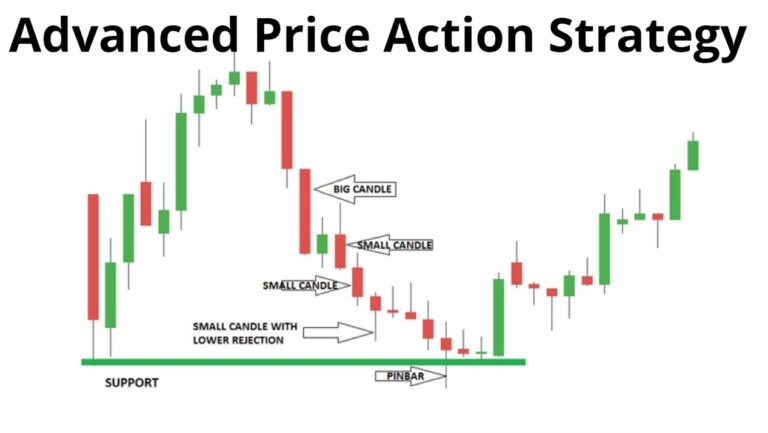
- Support and Resistance Levels: Support and resistance levels are significant price levels to which the market tends to react. By plotting these levels on your charts, you can spot areas where price may reverse or consolidate, helping you make more informed trading decisions.
- Shapes and Text Annotations: MT4 also offers the ability to draw shapes such as rectangles, triangles, and ellipses, which can be used to highlight specific chart patterns or price formations. Additionally, you can add text annotations to provide explanations or reminders directly on your charts.
Benefits of Annotating Charts on MT4
How do I use technical indicators and add them to my charts on MT4?
Now that we understand the drawing tools, let’s explore the benefits of annotating charts on MT4:
- Enhanced Analysis and Decision-Making: Annotated charts provide visual clarity, allowing you to identify patterns, trends, and key levels at a glance. This helps you make well-informed trading decisions based on a holistic understanding of the market.
- Clear Communication of Ideas and Strategies: By sharing annotated charts with fellow traders or clients, you can effectively communicate your trading ideas, strategies, and analysis. Visual annotations make it easier for others to understand your perspectives.
- Improved Trade Planning and Execution: Annotated charts assist in trade planning by helping you identify entry and exit points, set stop-loss and take-profit levels, and manage risk effectively. They provide a visual roadmap for your trades.
Step-by-Step Guide: Using Drawing Tools to Annotate Charts on MT4
Now, let’s dive into a step-by-step guide on how to use the drawing tools to annotate your charts on MT4: It’s better to compare different broker spreads and services like instant withdrawal. A reputable forex broker is the key to long-term success.
A. Opening a chart and accessing the drawing tools:
- Select the desired currency pair or asset.
- Right-click on the chart and navigate to the “Objects” menu.
- Choose the “Trendline” or “Horizontal Line” option to access the drawing tools.
B. Drawing trendlines and measuring angles:
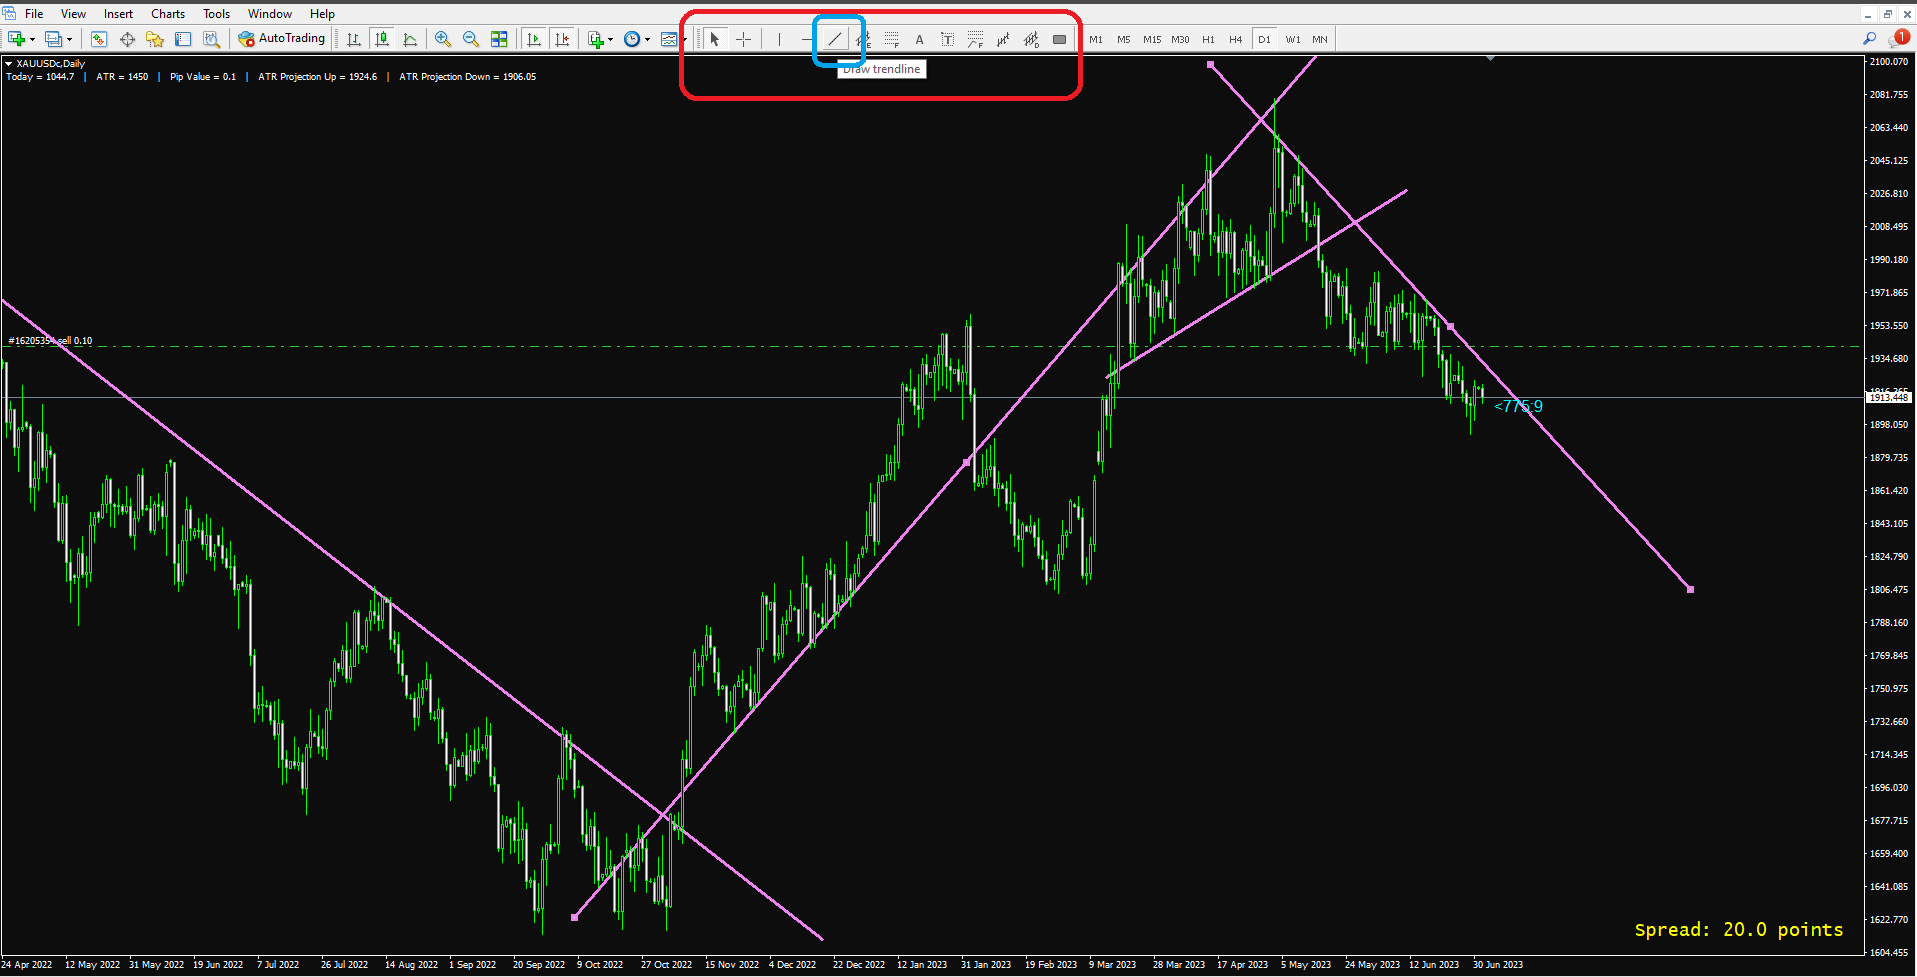
- Click and drag to draw a trendline on your chart.
- Right-click on the trendline and select “Properties” to customize its appearance.
- To measure the angle of a trendline, right-click on it and choose “Trendline Properties.” The angle will be displayed in degrees.
C. Placing horizontal and vertical lines:
- Select the “Horizontal Line” or “Vertical Line” tool from the drawing tools menu.
- Click and drag on the chart to place the line at the desired price level or vertical position.
D. Applying Fibonacci retracement levels:
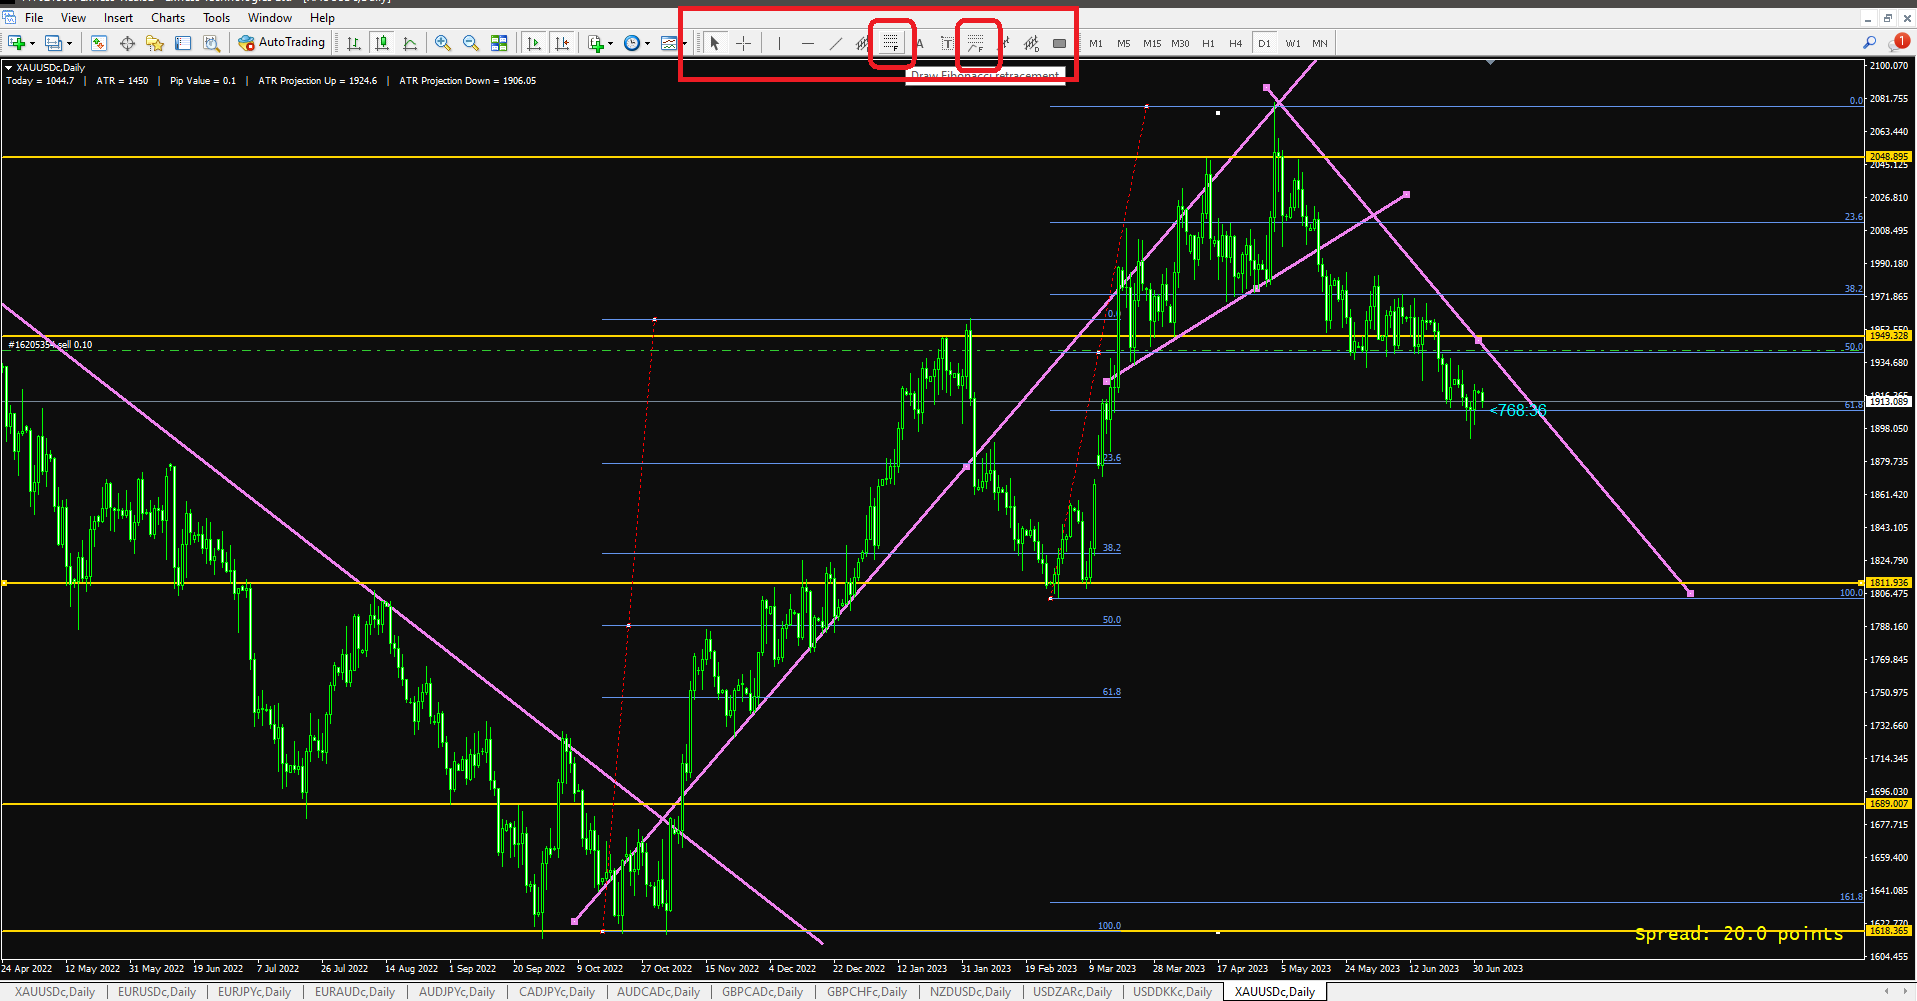
- Select the “Fibonacci Retracement” tool from the drawing tools menu.
- Click and drag from a swing high to a swing low or vice versa.
- The Fibonacci levels will automatically appear on the chart, indicating potential retracement zones.
E. Identifying support and resistance levels:
- Use the “Horizontal Line” tool to draw lines at key support and resistance levels on the chart.
- Adjust the lines as needed to align with significant price areas.
F. Adding shapes and text annotations:
- Choose the desired shape (rectangle, triangle, ellipse) from the drawing tools menu.
- Click and drag on the chart to create the shape.
- To add text annotations, select the “Text” tool from the drawing tools menu and click on the desired location on the chart.
Advanced Tips and Techniques for Annotating Charts on MT4
How to Use Forex Custom Indicators, Templates, and Profiles in MT4?
To maximize the effectiveness of your chart annotations, consider the following advanced tips and techniques:
A. Customizing drawing tool settings:
- Experiment with different line colors, thicknesses, and styles to suit your preferences.
- Customize Fibonacci retracement levels based on your trading strategy or preferences.
B. Saving and loading custom templates:
- Save your annotated charts as templates for future use.
- Load saved templates to quickly apply your preferred annotations to new charts.
C. Using hotkeys for faster annotation:
- Learn the keyboard shortcuts for frequently used drawing tools to speed up the annotation process.
- This can improve efficiency and save valuable time during market analysis.
D. Utilizing drawing tools for pattern recognition:
- Combine different drawing tools to identify chart patterns such as triangles, wedges, or double tops/bottoms.
- Annotations can help you spot potential breakout or reversal opportunities.
Best Practices for Effective Chart Annotation
To ensure your chart annotations are clear, organized, and meaningful, follow these best practices:
A. Keeping annotations clean and organized:
- Avoid cluttering the chart with too many annotations.
- Use different colors or line styles for different types of annotations to distinguish between them.
B. Using different colors and line styles for clarity:
- Color-code trendlines, support/resistance levels, or other annotations to make them visually distinct.
- Choose line styles (solid, dashed, dotted) that suit the purpose of the annotation.
C. Removing unnecessary annotations:
- Regularly review your annotated charts and remove outdated or irrelevant annotations.
- This ensures your analysis remains up-to-date and focused on current market conditions.
D. Updating annotations as the market evolves:
- Continuously monitor the market and adjust your annotations accordingly.
- Price levels, trends, and support/resistance areas can shift, requiring updates to your annotations.
Frequently Asked Questions
How do I view my trade history on MT4, save it in html form, and share it with others?
Q1: How can I access the drawing tools in MT4?
- To access the drawing tools in MT4, simply right-click on the chart and navigate to the “Objects” menu. From there, you can choose various drawing tools such as trendlines, horizontal and vertical lines, Fibonacci retracement, support and resistance levels, as well as shapes and text annotations.
Q2: Can I customize the appearance of my annotations in MT4
- Yes, you can customize the appearance of your annotations in MT4. Right-click on the annotation you want to customize and select “Properties.” This will allow you to adjust properties such as color, line thickness, and line style. By customizing the appearance, you can make your annotations more visually distinct and tailored to your preferences.
Q3: How do I measure the angle of a trendline in MT4?
- To measure the angle of a trendline in MT4, right-click on the trendline and select “Properties.” In the properties menu, you will find an option to display the angle in degrees. This feature enables you to quantify the slope of the trendline and assess the steepness of a trend.
Q4: Can I save my annotated charts as templates in MT4?
Yes, you can save your annotated charts as templates in MT4. To do this, right-click on the chart and select “Template” from the menu. Then choose “Save Template” and give it a name. Saved templates allow you to quickly apply your preferred annotations to new charts, saving you time and effort in the analysis process.
Q5: Is it possible to remove or update annotations on my charts in MT4?
- Absolutely! You can remove or update annotations on your charts in MT4. To remove an annotation, simply click on it and press the “Delete” key on your keyboard, or right-click and select “Delete.” If you want to update an annotation, right-click on it, select “Properties,” and make the desired changes. This flexibility ensures that you can keep your charts organized and up to date with evolving market conditions.
Conclusion of Forex Drawing Tools
Annotating charts on MT4 with drawing tools is a valuable practice for Forex traders. By utilizing trendlines, Fibonacci retracements, support/resistance levels, shapes, and text annotations, you can enhance your analysis, effectively communicate your ideas, and improve your trade planning and execution. Apply the step-by-step guide, incorporate advanced techniques, and follow best practices to leverage the power of chart annotations and gain a competitive edge in your trading journey.
Do you need a Deep Road Map for Forex learning? Structural Forex Trading Learning Road Map
We value your feedback and insights! We invite you, our esteemed readers, to share your thoughts and experiences related to using drawing tools to annotate charts on MT4. Have you found certain tools particularly helpful? Do you have any additional tips or techniques that you’ve discovered along the way? We encourage you to leave your comments below and engage in a meaningful discussion. Your contributions will not only enrich the conversation but also provide valuable knowledge to fellow traders. Let’s collaborate and continue learning together!