Welcome to the world of Forex trading, where success is often determined by the mastery of Forex price action. In this guide, we’ll unravel the essence of Forex price action trading, diving into five essential concepts that can significantly improve your trading strategy. Whether you’re a novice or a seasoned trader, understanding these fundamentals is crucial for navigating the Forex market effectively.
Understanding Price Action Trading
Which Forex broker is reliable for Forex trading and has less spread and instant withdrawal?
What is Price Action Trading?
Price action trading is a strategy that revolves around analyzing historical price data to make informed trading decisions. Instead of relying on lagging indicators, price action traders focus on the behavior of the price itself. This approach is rooted in the belief that all market information is reflected in price, making it the most reliable indicator.
Price Action Fundamentals
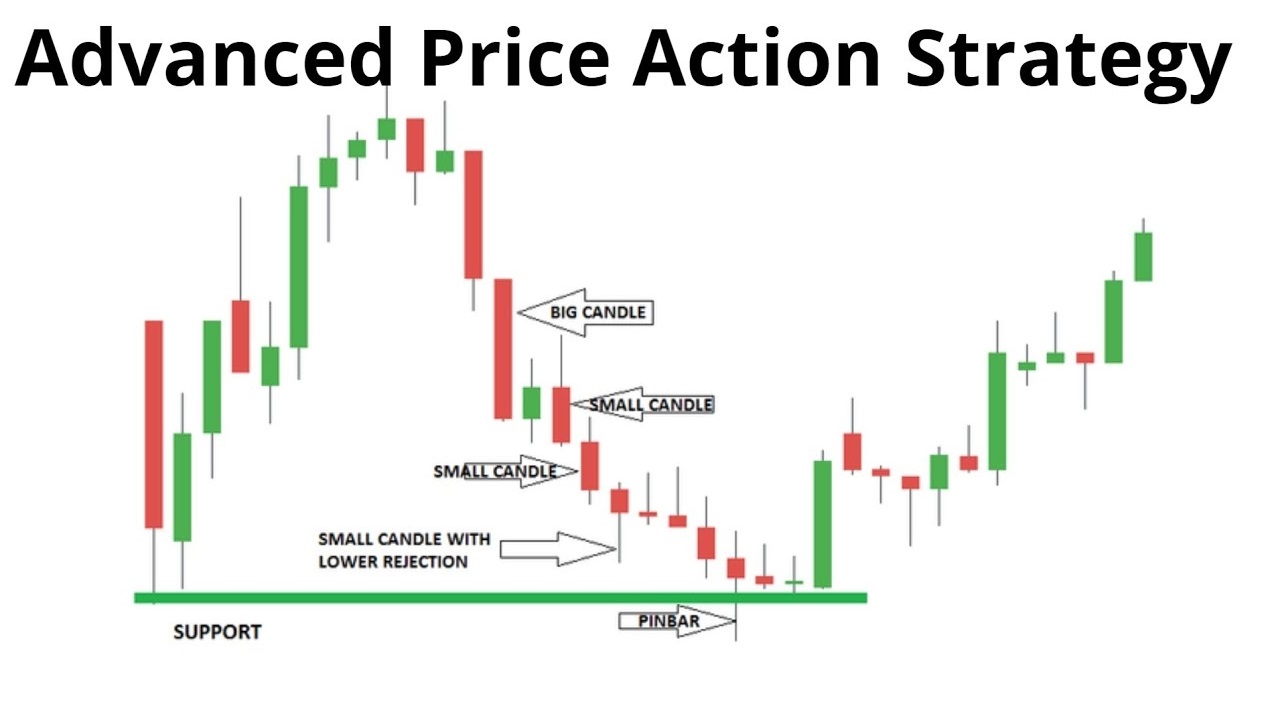
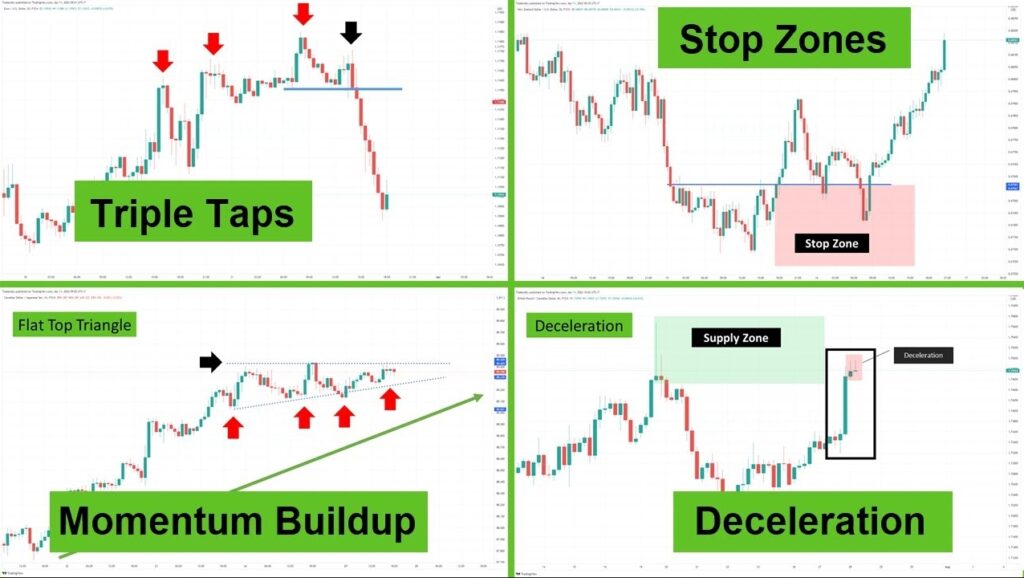
At its core, price action trading revolves around understanding the fundamentals of price movement. It’s about recognizing the patterns, trends, and movements in price over time. Here, let’s explore two fundamental concepts:
- Candlestick Patterns: Candlestick charts display price information in a visually intuitive way. Patterns such as “doji,” “hammer,” and “engulfing” can signal potential market reversals or continuations.
- Example: A “doji” pattern, characterized by a small candle with an opening and closing price almost equal, often signifies market indecision. If a doji appears after a prolonged uptrend, it could indicate a potential reversal.
- Philosophy Behind Price Action: Price action trading is not just about patterns; it’s about understanding market psychology. By analyzing price movements, you can gain insights into market sentiment.
- Example: A sudden price drop followed by a rapid recovery might indicate that the market is driven by fear and greed. This insight can inform your trading decisions.
Reading and Interpreting Candlestick Patterns
What are Support Resistance and Chart types in Forex trading?
Introduction to Candlestick Patterns
Candlestick patterns are the bread and butter of price action traders. They offer valuable insights into market sentiment. Here are some common patterns you should be familiar with:
- Bullish Engulfing: This pattern occurs when a small bearish candle is followed by a larger bullish candle that engulfs the previous one. It suggests a potential reversal from a downtrend to an uptrend.
- Bearish Harami: A bearish harami consists of a large bullish candle followed by a small bearish candle. It indicates potential weakness in an uptrend.
Interpreting Candlestick Patterns
How to Identify Support and Resistance Levels in Technical Analysis?
Let’s illustrate this with an example:
Imagine you’re monitoring a currency pair, and you notice a “bullish engulfing” pattern forming after a prolonged downtrend. This could signal a reversal, prompting you to consider a long position.
Support and Resistance Levels in Price Action
Identifying Support and Resistance
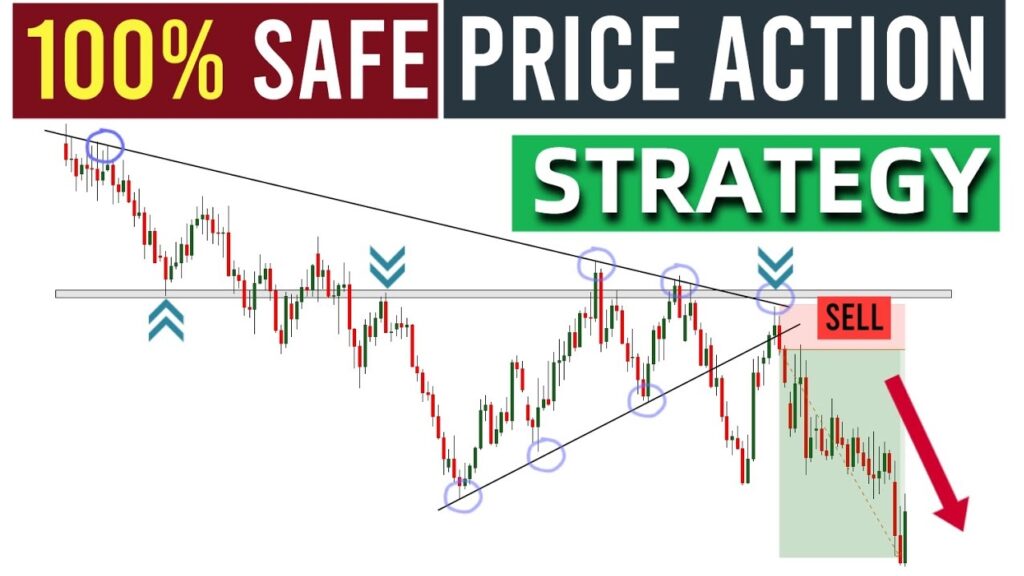
Support and resistance levels are key price points where buying or selling pressure can be significant. Identifying these levels is crucial for price action traders.
- Support Levels: These are price levels where buying interest is strong enough to prevent further decline.
- Resistance Levels: Resistance levels are where selling pressure can halt an uptrend.
Trading Strategies Using Support and Resistance
Consider this real-world scenario:
You’re analyzing a currency pair, and you notice that it has repeatedly bounced off a particular price level (support) for the past few weeks. This information can guide your trading strategy. If the price approaches that level again, you might consider going long, anticipating a bounce.
Combining Price Action with Other Analysis Techniques
What are Forex chart patterns and why are they essential?
Introduction to Analysis Techniques
While price action is powerful on its own, it can be even more effective when combined with other analysis methods, such as technical and fundamental analysis.
Synergies with Price Action
Let’s say you’re using both technical indicators and price action. Your technical indicators show a strong bullish signal, but price action suggests a potential reversal. In this case, you might exercise caution and consider waiting for more confirmation before making a trade.
Practical Application
Now that you understand these essential price action concepts, it’s time to put them into practice. Consider using a demo trading account to test your knowledge and refine your skills. Real-world experience is invaluable in the world of Forex trading.
Common Mistakes to Avoid
While mastering price action is a valuable skill, there are common pitfalls to avoid. Some traders become overly reliant on price action and neglect other forms of analysis. Remember that a well-rounded approach often yields the best results.
What are the most popular 7 Moving Average strategies?
Frequently Asked Questions
1. What is price action trading?
- Price action trading is a strategy that involves analyzing historical price movements to make trading decisions. It focuses on understanding market psychology and reading candlestick patterns, without relying on traditional indicators.
2. Why is price action trading important?
- Price action trading provides a clear and direct view of market sentiment and potential price movements. It helps traders make informed decisions by interpreting patterns and recognizing key support and resistance levels.
3. Are candlestick patterns reliable for trading?
- Candlestick patterns can be reliable indicators when used in conjunction with other analysis techniques. While they offer valuable insights into market sentiment, traders should confirm signals with additional factors before making trading decisions.
4. How do I identify support and resistance levels?
- Support levels are identified where buying interest is strong enough to halt a price decline, while resistance levels are where selling pressure can stall an uptrend. Traders often use historical price data and chart analysis to pinpoint these levels.
5. Can I combine price action with other analysis methods?
- Yes, price action can be effectively combined with technical and fundamental analysis. Integrating these approaches allows traders to make more comprehensive and well-informed trading decisions, reducing the risk of false signals.
- What is Risk Management in Forex Trading and Calculating position sizes and more?
Conclusion of Forex Price Action Trading
In conclusion, price action trading is a cornerstone of successful Forex trading. By understanding the fundamentals, reading candlestick patterns, identifying support and resistance levels, and integrating price action with other analysis techniques, you can gain a competitive edge in the market. Remember that practice and continuous learning are key to mastering these concepts. Happy trading!
Do you need a Deep Road Map for Forex learning? Structural Forex Trading Learning Road Map
We encourage you to share your thoughts, questions, and experiences with price action trading in the comments section below. Your insights can enrich the trading community and foster discussions that benefit all traders.