When it comes to navigating the dynamic world of Forex trading, mastering technical indicators is essential for success. Among these indicators, oscillators hold a special place, as they can help traders identify potential trend reversals and overbought/oversold conditions. This article will delve into the top 7 Forex trading oscillators – Relative Strength Index (RSI), Moving Average Convergence Divergence (MACD), and Stochastic – and explore how you can leverage their power to make more profitable trades.
Relative Strength Index (RSI)
Which Forex broker is reliable for Forex trading and has less spread and instant withdrawal?
The Relative Strength Index (RSI) is a momentum oscillator that measures the speed and change of price movements. RSI values range from 0 to 100, with readings above 70 indicating overbought conditions and readings below 30 indicating oversold conditions.
Understanding RSI and its Calculation
RSI is calculated using the average gain and average loss over a specific period. The formula is as follows:
RSI = 100 – (100 / (1 + RS))
where RS (Relative Strength) is the average gain divided by the average loss.
Interpreting RSI Readings
An RSI reading above 70 suggests that the asset is overbought and may be due for a correction or reversal. Conversely, an RSI reading below 30 indicates that the asset is oversold and may be poised for a potential upward move.
RSI Trading Strategies
What is fundamental analysis in Forex trading?
a. RSI Overbought and Oversold Levels: When the RSI reaches extreme levels (above 70 or below 30), traders may consider entering a trade in the opposite direction, anticipating a reversal.
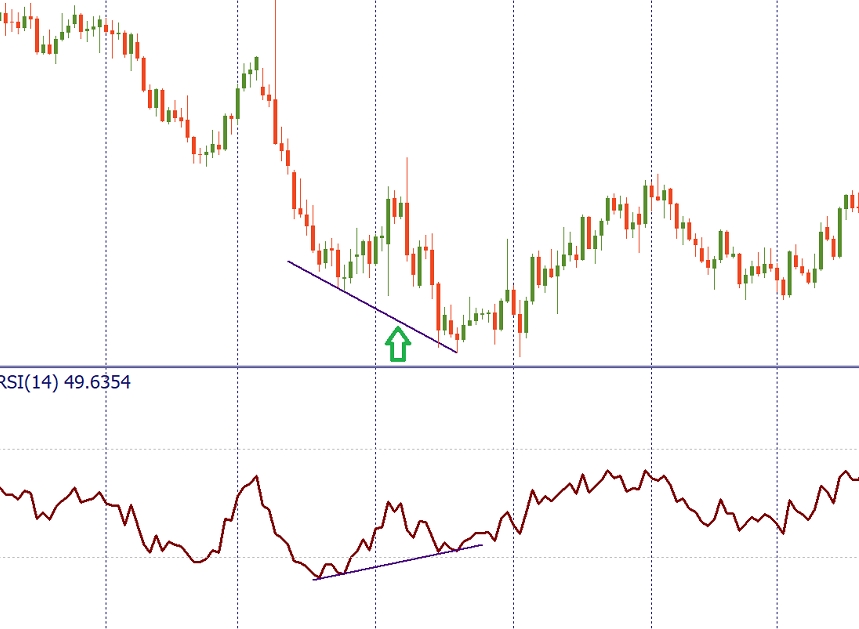
b. RSI Divergence: Divergence occurs when the price and the RSI indicator move in opposite directions. Bullish divergence, where the price forms a lower low while the RSI forms a higher low, can signal a potential upward move. Bearish divergence, where the price forms a higher high while the RSI forms a lower high, can indicate a potential downward move.
c. RSI Centerline Crossovers: A centerline crossover occurs when the RSI crosses the 50 level. A move above 50 suggests bullish momentum, while a move below 50 suggests bearish momentum.
Real-Life Example: Let’s say you notice an RSI reading of 75 on a particular currency pair, indicating it’s overbought. As a savvy trader, you decide to short the currency pair, expecting a potential downward correction. Soon after, the price starts to decline, validating your RSI-based trade.
Moving Average Convergence Divergence (MACD)
What are Support Resistance and Chart types in Forex trading?
The Moving Average Convergence Divergence (MACD) is a trend-following momentum oscillator that consists of two lines – the MACD line and the signal line – as well as a histogram.
Explaining MACD Components
- The MACD Line: The MACD line is calculated by subtracting the 26-period Exponential Moving Average (EMA) from the 12-period EMA.
- The Signal Line: The signal line is a 9-period EMA of the MACD line.
- The Histogram: The histogram represents the difference between the MACD line and the signal line, providing a visual representation of the MACD’s movement.
How to Read MACD Charts
When the MACD line crosses above the signal line, it generates a bullish signal, suggesting potential upward momentum. Conversely, when the MACD line crosses below the signal line, it generates a bearish signal, suggesting potential downward momentum.
MACD Trading Techniques
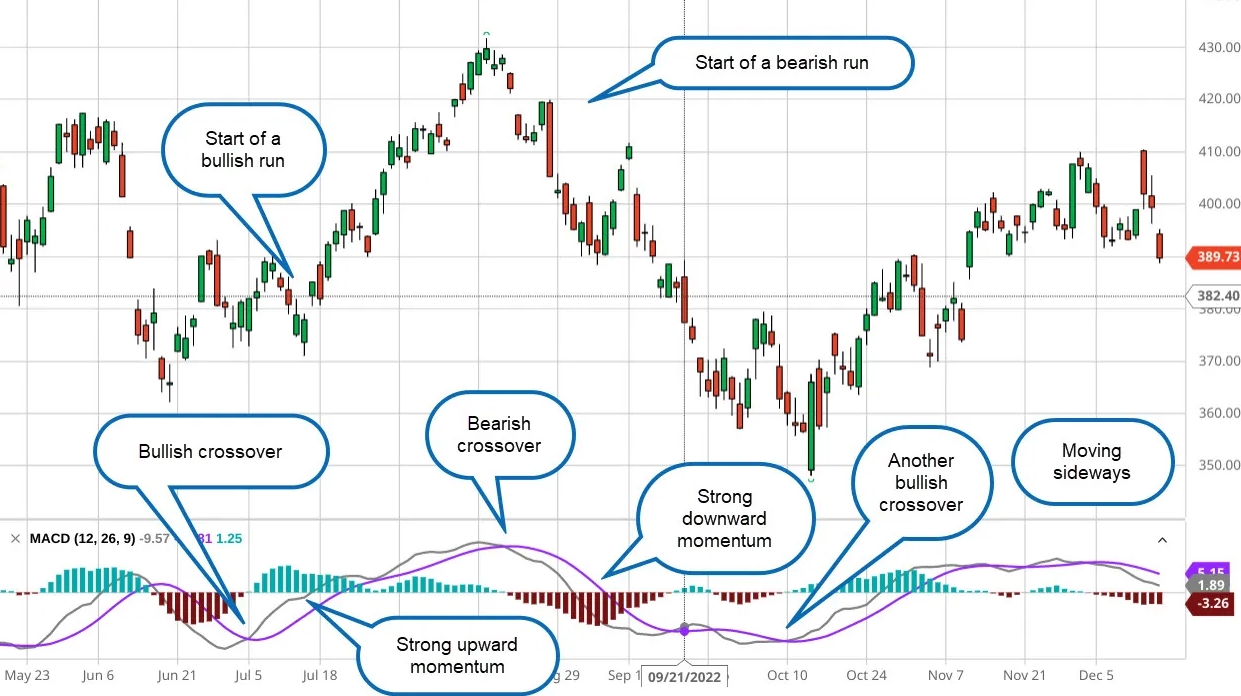
a. MACD Crossovers: Traders often look for bullish crossovers (MACD line crossing above the signal line) as a potential buy signal and bearish crossovers (MACD line crossing below the signal line) as a potential sell signal.
b. MACD Divergence: Similar to RSI, MACD divergence can also provide valuable insights into potential trend reversals. A bullish divergence occurs when the price forms a lower low while the MACD forms a higher low, signaling a possible uptrend. A bearish divergence occurs when the price forms a higher high while the MACD forms a lower high, signaling a possible downtrend.
c. MACD Histogram Patterns: Traders may also pay attention to patterns formed by the MACD histogram, such as convergence or divergence patterns, which can provide additional confirmation for potential trade entries and exits.
Real-Life Example: Suppose the MACD line crosses above the signal line, forming a bullish crossover. Recognizing this as a potential buy signal, you enter a long position on a currency pair. As the trend gains momentum, the MACD histogram continues to rise, supporting your decision to hold the trade until you observe a bearish crossover, indicating a potential trend reversal.
Stochastic Oscillator
How to Identify Support and Resistance Levels in Technical Analysis?
The Stochastic Oscillator is another momentum oscillator that compares a closing price to its price range over a specific period. It helps identify overbought and oversold conditions in the market.
Understanding Stochastic Oscillator and its Calculation
The Stochastic Oscillator comprises two lines – %K and %D. The %K line represents the current closing price’s position relative to the price range over a specific period. The %D line is a 3-period Simple Moving Average of the %K line.
Interpreting Stochastic Readings
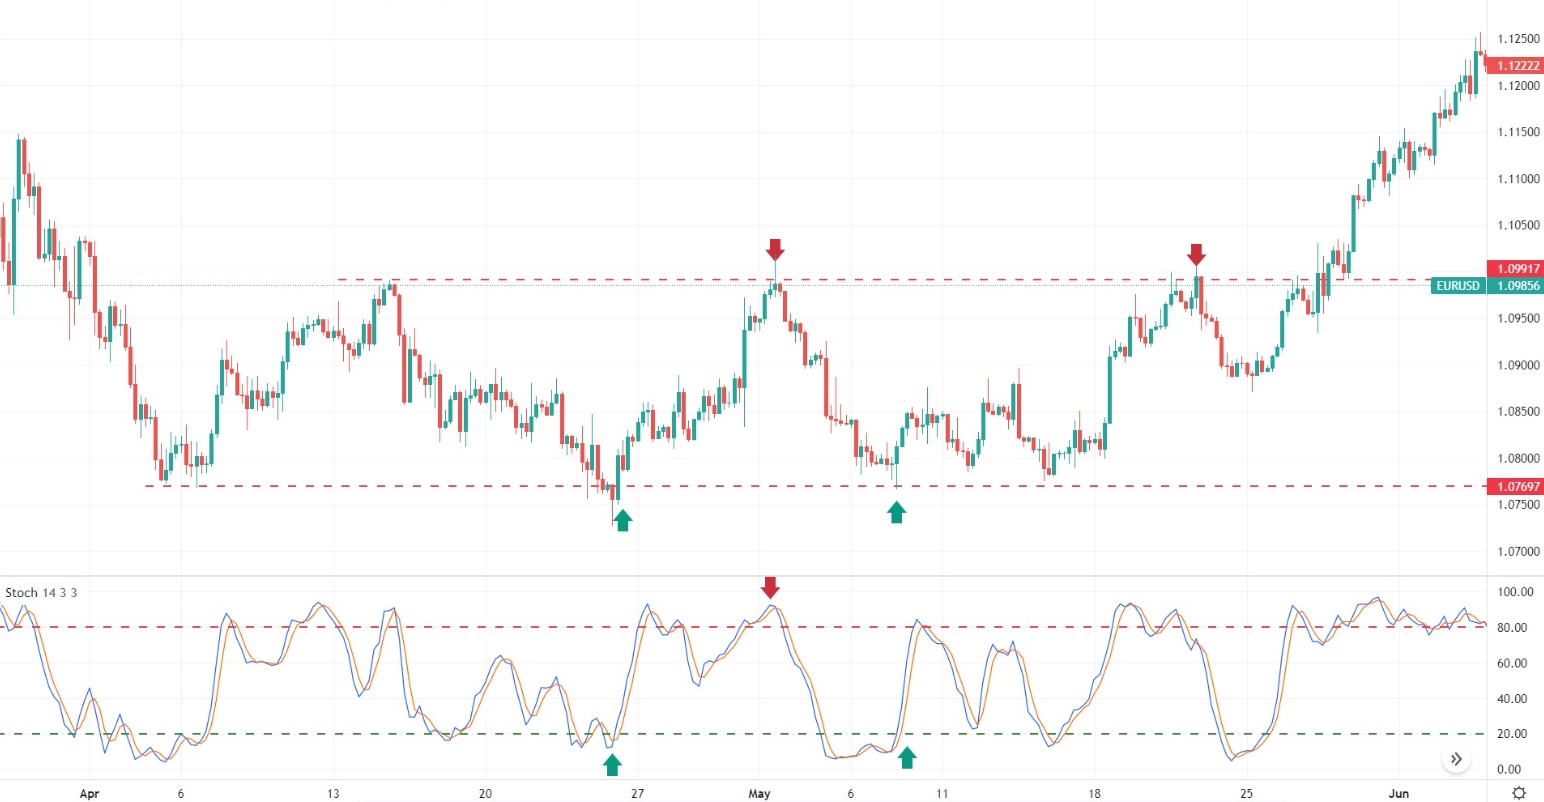
A reading above 80 indicates that the asset is overbought, while a reading below 20 indicates that it is oversold.
Stochastic Trading Strategies
a. Stochastic Overbought and Oversold Levels: Similar to RSI, traders can use overbought (above 80) and oversold (below 20) readings to identify potential trend reversals and generate trade signals.
b. Stochastic Crossovers: %K and %D crossovers can also provide trade signals. A bullish crossover (when %K crosses above %D) may signal a potential upward move, while a bearish crossover (when %K crosses below %D) may signal a potential downward move.
c. Stochastic Divergence: Stochastic divergence occurs when the price and the Stochastic Oscillator move in opposite directions. Bullish divergence (price forms a lower low, while the Stochastic forms a higher low) may suggest a potential uptrend, while bearish divergence (price forms a higher high, while the Stochastic forms a lower high) may suggest a potential downtrend.
Real-Life Example: As you analyze a currency pair, you notice the Stochastic Oscillator’s %K line crossing above the %D line, forming a bullish crossover in the oversold zone. This prompts you to enter a long position, expecting a potential upward move. As the currency pair’s price rises, the Stochastic Oscillator remains in the overbought zone, supporting your decision to hold the trade until the Stochastic lines form a bearish crossover, signaling a possible trend reversal.
Importance of Oscillator Convergence
What are Forex chart patterns and why it is essential?
What is Oscillator Convergence?
Oscillator convergence occurs when multiple oscillators provide similar signals or confirmations, increasing the reliability of potential trade setups.
How to Spot Oscillator Convergence in Forex Charts?
Traders can identify oscillator convergence by observing multiple oscillators (e.g., RSI, MACD, and Stochastic) showing similar overbought/oversold conditions, crossovers, or divergence patterns simultaneously.
Using Convergence for Confirmation and Entry Signals
When multiple oscillators converge, traders gain stronger confirmation of a potential trend reversal or continuation, providing more confidence in their trade entries and exits.
Real-Life Example: You decide to analyze a currency pair using the RSI, MACD, and Stochastic. All three oscillators reveal overbought conditions and exhibit bearish divergence patterns simultaneously. This convergence strengthens your conviction in a potential downward move, leading you to take a short position on the currency pair. As the price steadily declines, you gain confidence in your trade, and the convergence of these oscillators proves to be a valuable confirmation tool.
Combining Oscillators with Other Technical Indicators
What are the most popular 7 Moving Average strategies?
Selecting Complementary Indicators
To enhance your trading strategy, consider using oscillators in conjunction with other technical indicators, such as trend-following indicators (e.g., Moving Averages) or support and resistance levels.
Examples of Effective Indicator Combinations
a. RSI with Moving Averages: Combining RSI with Moving Averages can help traders identify trend reversals with greater precision. When the RSI crosses above a long-term Moving Average, it may signal a potential uptrend, and vice versa.
b. MACD with Bollinger Bands: Using MACD in conjunction with Bollinger Bands can provide insights into potential price volatility and trend strength. When the MACD line moves beyond the Bollinger Bands, it may signal an impending price breakout.
Real-Life Example: You decide to combine the Stochastic Oscillator with the 50-day and 200-day Moving Averages. As the Stochastic Oscillator indicates an oversold condition and forms a bullish crossover, the price of the currency pair is also above both Moving Averages. This combination provides a strong buy signal, suggesting a potential trend reversal to the upside. The trade proves successful as the price steadily climbs, validating the effectiveness of combining oscillators with other technical indicators.
Oscillator Trading Tips and Best Practices
Setting Proper Timeframes for Oscillators
Different timeframes produce different signals, so select appropriate timeframes based on your trading style and goals. Short-term traders may use shorter timeframes (e.g., 5 minutes or 1 hour), while long-term traders may prefer longer timeframes (e.g., daily or weekly).
Managing Risk and Setting Stop-Loss Levels
Use risk management techniques such as setting stop-loss levels to protect your capital from substantial losses in case the trade goes against your expectations.
Backtesting Oscillator Strategies
Before implementing any oscillator-based strategy, perform thorough backtesting to assess its historical performance. This helps you understand its strengths and weaknesses and gain confidence in its effectiveness.
Avoiding Common Oscillator Mistakes
Avoid overtrading based solely on oscillator signals. Use oscillators in combination with other technical indicators and fundamental analysis to make informed trading decisions.
Frequently Asked Questions
How are trend lines and channels used in technical analysis?
Q: What are Forex trading oscillators?
- Forex trading oscillators are technical indicators used in the foreign exchange market to analyze price momentum, identify overbought or oversold conditions, and signal potential trend reversals. Some popular Forex oscillators include the Relative Strength Index (RSI), Moving Average Convergence Divergence (MACD), and Stochastic Oscillator.
Q: How do I interpret RSI readings in Forex trading?
- The Relative Strength Index (RSI) ranges from 0 to 100 and helps traders gauge the strength of price movements. Readings above 70 indicate an overbought condition, suggesting a potential downward correction or reversal. Conversely, readings below 30 indicate an oversold condition, suggesting a potential upward correction or reversal.
Q: What is MACD and how can it be used in Forex trading?
The Moving Average Convergence Divergence (MACD) is a trend-following momentum oscillator. It consists of the MACD line, signal line, and histogram. Traders use MACD crossovers, where the MACD line crosses above or below the signal line, to identify potential trend changes. Additionally, MACD divergence, comparing price and MACD movements, can provide insights into potential trend reversals.
Q: How does the Stochastic Oscillator work in Forex trading?
The Stochastic Oscillator compares a currency pair’s closing price to its price range over a specific period. The oscillator generates values between 0 and 100. Readings above 80 indicate an overbought condition, while readings below 20 indicate an oversold condition. Traders often use stochastic crossovers and stochastic divergence to spot potential trade opportunities.
Q: Can I combine multiple oscillators in my Forex trading strategy?
Yes, combining multiple oscillators can enhance your trading strategy by providing stronger confirmation signals. For instance, if the RSI, MACD, and Stochastic all show similar overbought conditions, it can increase confidence in a potential downward move. However, it’s essential to use oscillators in conjunction with other technical indicators and conduct thorough backtesting before implementing any strategy.
Q: How important is risk management in Forex trading?
Risk management is crucial in Forex trading to protect your capital from significant losses. Setting appropriate stop-loss levels and position sizing based on your risk tolerance are essential practices. By managing risk effectively, traders can withstand market fluctuations and preserve their trading capital for long-term success.
Q: How can I contribute to the Forex trading community and share my experiences?
We encourage you to share your thoughts, experiences, and insights in the comment section below the article. Your contributions can help others learn and grow in their Forex trading journey. Feel free to ask questions, offer trading tips, or share success stories. Together, we can create a supportive and engaging community of traders.
Conclusion
In conclusion, Forex trading oscillators, such as RSI, MACD, and Stochastic, are powerful tools that can significantly improve your trading performance. By understanding their calculations, interpreting readings, and implementing effective trading strategies, you can identify high-probability trade setups and increase your chances of success in the dynamic Forex market. Remember to use oscillators with other technical indicators, practice prudent risk management, and continuously learn and refine your trading approach for consistent profitability in Forex trading.
Do you need a Deep Road Map for Forex learning? Structural Forex Trading Learning Road Map
Thank you for taking the time to explore our article on the “Top 7 Forex Trading Oscillators (RSI, MACD, Stochastic) You Need to Master for Profitable Trades.” We hope you found the information insightful and helpful for your Forex trading journey. We invite you to share your thoughts and experiences with us by leaving a comment below. Whether you have additional questions, personal success stories, or would like to contribute your trading tips, we would love to hear from you. Your feedback and engagement are essential in creating a vibrant and supportive community of traders. Let’s learn and grow together as we navigate the exciting world of Forex trading. Happy trading, and we look forward to reading your comments!