Forex trading is an exciting financial market that offers immense profit potential. However, navigating the volatility can be challenging without the right strategies. One of the most popular tools in a trader’s arsenal is the Moving Average (MA). In this article, we’ll explore seven effective strategies for Forex trading using Moving Averages to help you make informed trading decisions and improve your chances of profitable trades.
Understanding Moving Averages in Forex Trading
Which Forex broker is reliable for Forex trading and has less spread and instant withdrawal?
Moving Averages are trend-following indicators that smooth out price data to identify the overall direction of a currency pair’s price movement. The two most commonly used MAs are the Simple Moving Average (SMA) and the Exponential Moving Average (EMA). The SMA calculates the average price over a specific period, while the EMA gives more weight to recent prices. Traders often use these MAs to identify trends and potential areas of support and resistance.
Golden Cross and Death Cross Strategies
The Golden Cross occurs when the shorter-term moving average (e.g., 50-day SMA) crosses above the longer-term moving average (e.g., 200-day SMA). This crossover is considered a strong buy signal, indicating a potential bullish trend. On the other hand, the Death Cross happens when the shorter-term moving average crosses below the longer-term moving average, signaling a potential bearish trend and serving as a sell signal.
Real-Life Example: EUR/USD daily chart showed a Golden Cross in May 2022, prompting traders to enter long positions. As a result, the pair experienced a sustained uptrend, offering profitable opportunities.
Moving Average Crossover Strategy
What is fundamental analysis in Forex trading?
The Moving Average Crossover strategy involves using two MAs, usually the 50-day SMA and the 200-day SMA. When the shorter-term MA crosses above the longer-term MA, it signals a potential upward trend and a buying opportunity. Conversely, when the shorter-term MA crosses below the longer-term MA, it indicates a potential downtrend and a selling opportunity.
Real-Life Example: GBP/JPY 4-hour chart displayed a bullish Moving Average Crossover in October 2022, leading to a strong uptrend, allowing traders to capitalize on upward price movements.
Moving Average Envelope Strategy
The Moving Average Envelope strategy adds a percentage-based margin above and below a single Moving Average. These upper and lower bands act as dynamic support and resistance levels. Breakouts above the upper envelope may signal a bullish trend continuation, while breakdowns below the lower envelope suggest a bearish trend continuation.
Real-Life Example: USD/CAD hourly chart demonstrated a bullish breakout above the upper envelope in September 2022, indicating an extended uptrend, presenting traders with a profitable long trade opportunity.
Moving Average Ribbon Strategy
The Moving Average Ribbon strategy involves plotting multiple MAs of varying periods on the same chart. This technique enhances trend identification and helps traders distinguish between strong and weak trends. When the ribbon aligns in a bullish sequence, it indicates a potential uptrend, while a bearish alignment suggests a potential downtrend.
Real-Life Example: AUD/USD 1-hour chart exhibited a bullish Moving Average Ribbon alignment in January 2023, signifying a strong upward trend, offering traders profitable long positions.
Moving Average Divergence Strategy
What are Support Resistance and Chart types in Forex trading?
Moving Average Divergence occurs when the price and the Moving Average move in opposite directions. This signals a potential trend reversal and can help traders identify entry and exit points. Positive divergence indicates a bullish reversal, while negative divergence suggests a bearish reversal.
Real-Life Example: USD/JPY daily chart displayed a positive Moving Average Divergence in February 2023, indicating a potential trend reversal, allowing traders to capitalize on the subsequent uptrend.
Moving Average and Fibonacci Retracement Strategy
Combining Moving Averages with Fibonacci retracement levels helps traders identify key support and resistance zones. The MAs provide trend direction, while Fibonacci retracement levels highlight potential reversal points. Traders can enter long positions near the support levels and short positions near the resistance levels.
Real-Life Example: EUR/GBP 4-hour chart revealed a bullish bounce off the 61.8% Fibonacci retracement level in March 2023, confirming the support zone, leading to profitable long trades.
Moving Average Slope Strategy
The Moving Average Slope strategy focuses on the angle of the Moving Average line. An upward slope indicates a bullish trend, while a downward slope suggests a bearish trend. Traders can use this strategy to confirm existing trends and identify potential trend reversals.
Real-Life Example: NZD/USD 1-hour chart showed a steep upward slope in April 2023, indicating a strong bullish trend, providing traders with lucrative long opportunities.
Frequently Asked Questions
How to Identify Support and Resistance Levels in Technical Analysis?
Q1: What are Moving Averages and how do they work in Forex trading?
- Moving Averages (MAs) are trend-following indicators that smooth out price data to identify the overall direction of a currency pair’s price movement. The two commonly used MAs are Simple Moving Average (SMA) and Exponential Moving Average (EMA). SMAs calculate the average price over a specific period, while EMAs give more weight to recent prices. Traders use MAs to spot trends, potential areas of support and resistance, and to generate buy/sell signals based on MA crossovers.
Q2: How can I use Moving Averages to identify trend reversals?
- Moving Average Crossovers are commonly used to identify trend reversals. When a shorter-term MA crosses above a longer-term MA, it signals a potential uptrend, and when it crosses below, it indicates a potential downtrend. Another method is using Moving Average Divergence, where price and MAs move in opposite directions, signaling a potential trend reversal.
Q3: What are the Golden Cross and Death Cross strategies in Forex trading?
- The Golden Cross occurs when the shorter-term moving average (e.g., 50-day SMA) crosses above the longer-term moving average (e.g., 200-day SMA), signaling a potential bullish trend and a buy signal. The Death Cross happens when the shorter-term moving average crosses below the longer-term moving average, indicating a potential bearish trend and a sell signal. Traders use these crossovers to identify trend changes and potential entry/exit points.
Q4: How can I use Moving Averages for risk management?
- Moving Averages can be utilized for risk management by serving as dynamic support and resistance levels. For instance, in the Moving Average Envelope strategy, adding percentage-based margins above and below an MA creates support and resistance bands. Traders can use these bands to set stop-loss levels, helping to protect profits and minimize potential losses during price fluctuations.
Q5: Can I combine Moving Averages with other technical indicators for better trading decisions?
- Yes, combining Moving Averages with other technical indicators can lead to more robust trading strategies. Traders often use MAs in conjunction with tools like Fibonacci retracement levels to identify key support and resistance zones. Additionally, using oscillators like the Relative Strength Index (RSI) or Moving Average Convergence Divergence (MACD) with MAs can confirm potential entry and exit points, enhancing the overall effectiveness of your trading decisions.
What are Forex chart patterns and why are they essential?
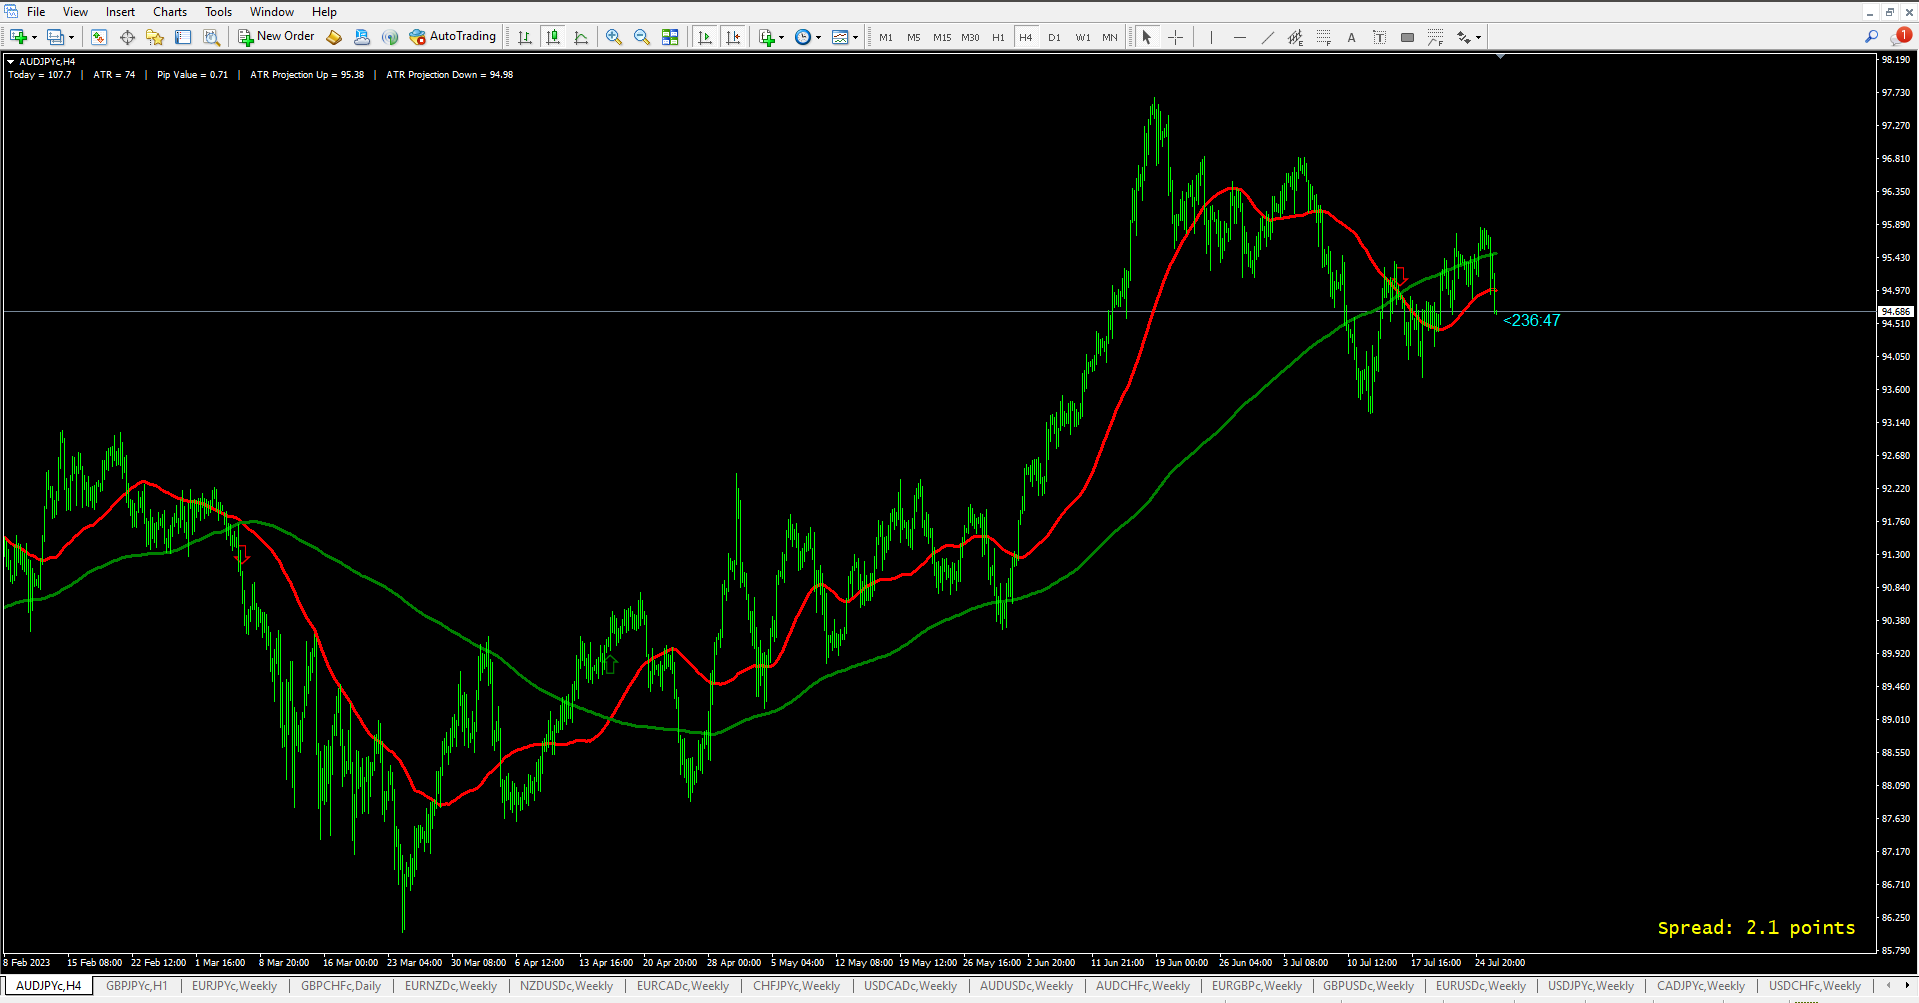
MT4 and MT5 Moving Average Crossover Alert
Download MT4 and MT5 Moving Average Crossover Alert
[lockercat] Download MT4 and MT5 Moving Average Crossover Alert [/lockercat]
The Moving Average Crossover Alert indicator helps traders to easily see the moving average cross and also this indicator sends a signal to the trader to notify that the moving average is crossed. you can get the signal via mobile, email, and onboard the mt4/ mt5 meta trader platform.
Conclusion of Forex Trading Using Moving Averages
Moving Averages are versatile tools that can significantly enhance your Forex trading strategies. The Golden Cross and Death Cross offer clear buy and sell signals, while the Moving Average Crossover helps identify trend reversals. The Moving Average Envelope, Ribbon, and Divergence strategies offer unique ways to spot trends and potential entry points. Additionally, combining Moving Averages with Fibonacci retracement levels and observing Moving Average Slopes can strengthen your trading decisions.
Remember that no strategy guarantees success and risk management is crucial in Forex trading. Test these strategies on demo accounts, adapt them to your trading style, and use proper risk management techniques to maximize profitability and minimize potential losses. Happy trading!
Do you need a Deep Road Map for Forex learning? Structural Forex Trading Learning Road Map
Thank you for taking the time to read our article on “7 Effective Forex Trading Strategies Using Moving Averages for Profitable Trades.” We hope you found the content insightful and informative. We believe that your input and experiences are invaluable to us and other readers. We invite you to share your thoughts, questions, or any additional strategies you might have related to Moving Averages in Forex trading. Your comments will not only enrich the discussion but also create a supportive and collaborative community of traders. So, don’t hesitate to leave your feedback below. We look forward to hearing from you!