Support and resistance levels are essential concepts in technical analysis, providing valuable insights into market trends and potential price movements. Whether you’re a seasoned trader or a novice investor, understanding how to identify Support and Resistance Levels in Technical Analysis is critical and can significantly enhance your decision-making process. In this guide, we’ll delve into the definitions, characteristics, and methods for identifying support and resistance levels, along with real-life examples to help you grasp these concepts easily.
Understanding Support Levels
Which Forex broker is reliable for Forex trading and has less spread and instant withdrawal?
Support levels refer to price points where an asset tends to stop declining as demand increases, preventing further downward movements. These levels act as price floors, creating buying interest and supporting the asset’s value. Identifying support levels is crucial as they present potential buying opportunities and indicate potential reversal points.
Characteristics of Support Levels:
- Previous Lows: Support levels are often formed at previous low points on a price chart, indicating areas where buyers have stepped in before.
- Consolidation Zones: Market consolidation creates support levels, reflecting a balance between buyers and sellers.
- Psychological Levels: Round numbers or significant price levels can act as psychological support, influencing traders’ decisions.
Key Factors Influencing Support Levels
- Market Sentiment: Positive news and strong market sentiment can bolster support levels.
- Trading Volume: Higher trading volumes at specific price levels indicate stronger support.
Identifying Support Levels
What is fundamental analysis in Forex trading?
Historical Price Analysis:
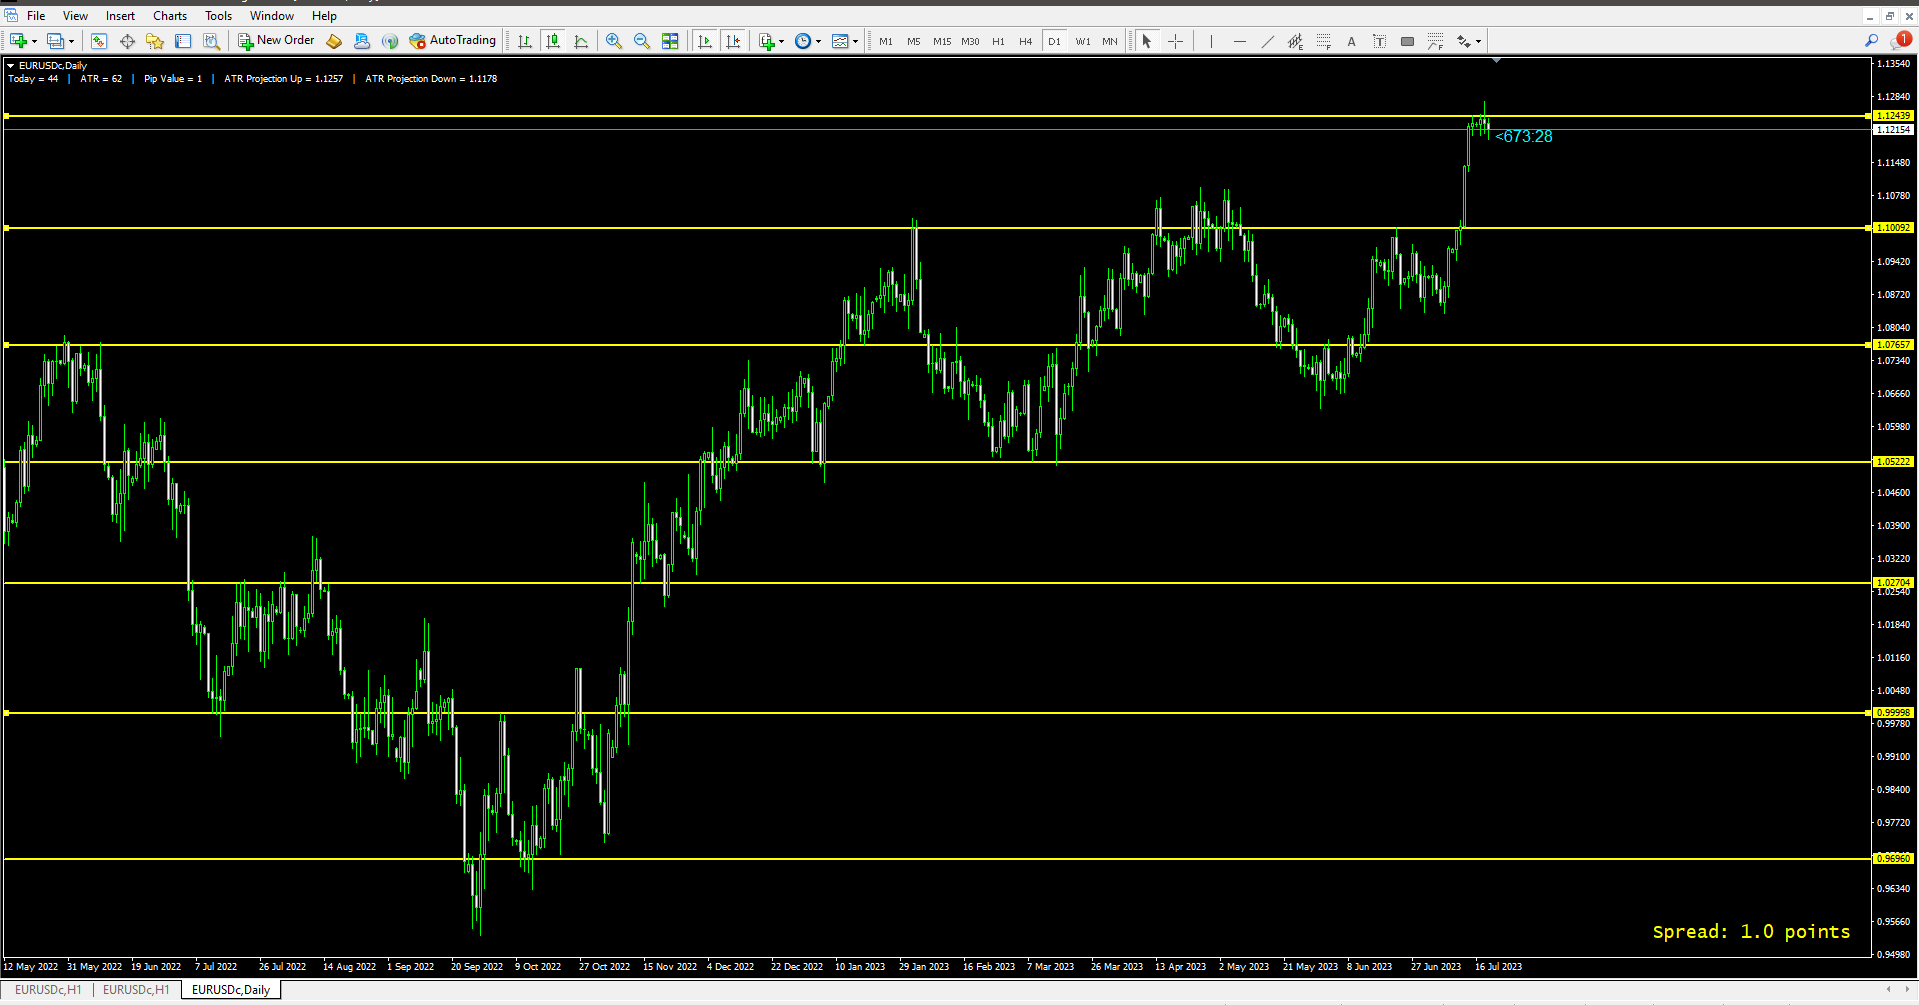
Analyzing historical price charts can reveal past support levels. Look for areas where the price has consistently bounced back or reversed direction.
Example: Bitcoin (BTC) Support Level During a bullish trend in Bitcoin, the price consistently found support at the $45,000 level over several months, demonstrating strong demand from buyers each time it approached this price.
Moving Averages as Support Indicators:
Moving averages, such as the 50-day or 200-day moving average, can act as dynamic support levels, indicating the average price over a specified period.
Example: Apple Inc. (AAPL) Support Level In the case of AAPL, the 200-day moving average acted as strong support during a downtrend, providing a potential entry point for long positions.
Volume Analysis and Support Confirmation:
Volume spikes at specific price levels can validate support areas. Higher trading volumes during price rebounds confirm the strength of the support level.
Example: Tesla Inc. (TSLA) Support Confirmation When the TSLA stock price dipped to $600, the trading volume surged significantly, indicating strong support at this level, which led to a subsequent price increase.
Understanding Resistance Levels
What are Chart types in Forex trading?
Resistance levels represent price points where an asset tends to stop rising as selling pressure increases, preventing further upward movements. These levels act as price ceilings, creating selling interest and limiting the asset’s value. Identifying resistance levels is vital as they offer potential selling opportunities and indicate potential reversal points.
Characteristics of Resistance Levels:
- Previous Highs: Resistance levels are typically formed at previous high points on a price chart, indicating areas where sellers have previously taken control.
- Trendlines and Channels: Sloping trendlines or price channels can identify dynamic resistance levels.
- Psychological Levels: Round numbers or significant price levels can act as psychological resistance, influencing traders’ decisions.
Key Factors Influencing Resistance Levels:
- Market Sentiment: Negative news or weak market sentiment can strengthen resistance levels.
- Trading Volume: Unusually high trading volumes at specific price levels suggest stronger resistance.
Identifying Resistance Levels:
Historical Price Analysis:
Analyzing historical price charts can reveal past resistance levels. Look for areas where the price has consistently struggled to break above.
Example: Amazon Inc. (AMZN) Resistance Level AMZN stock faced repeated resistance at the $3,500 level during an uptrend, indicating a significant selling interest at this price.
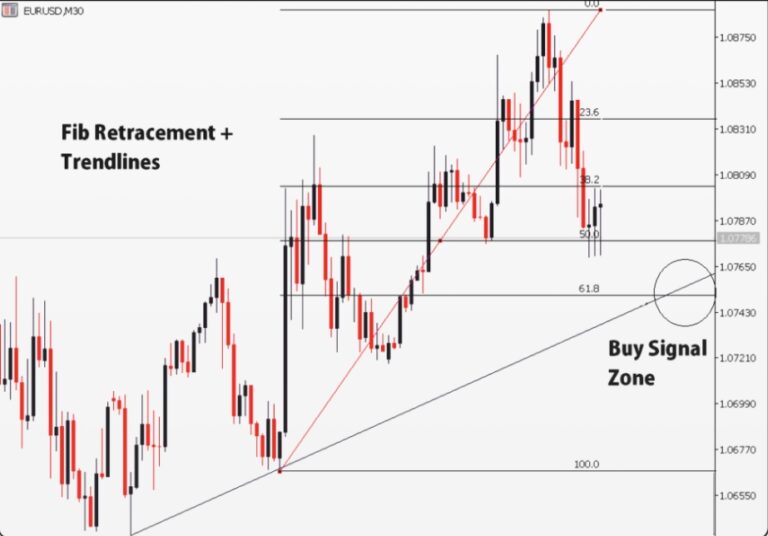
Trendlines and Channels as Resistance Indicators:
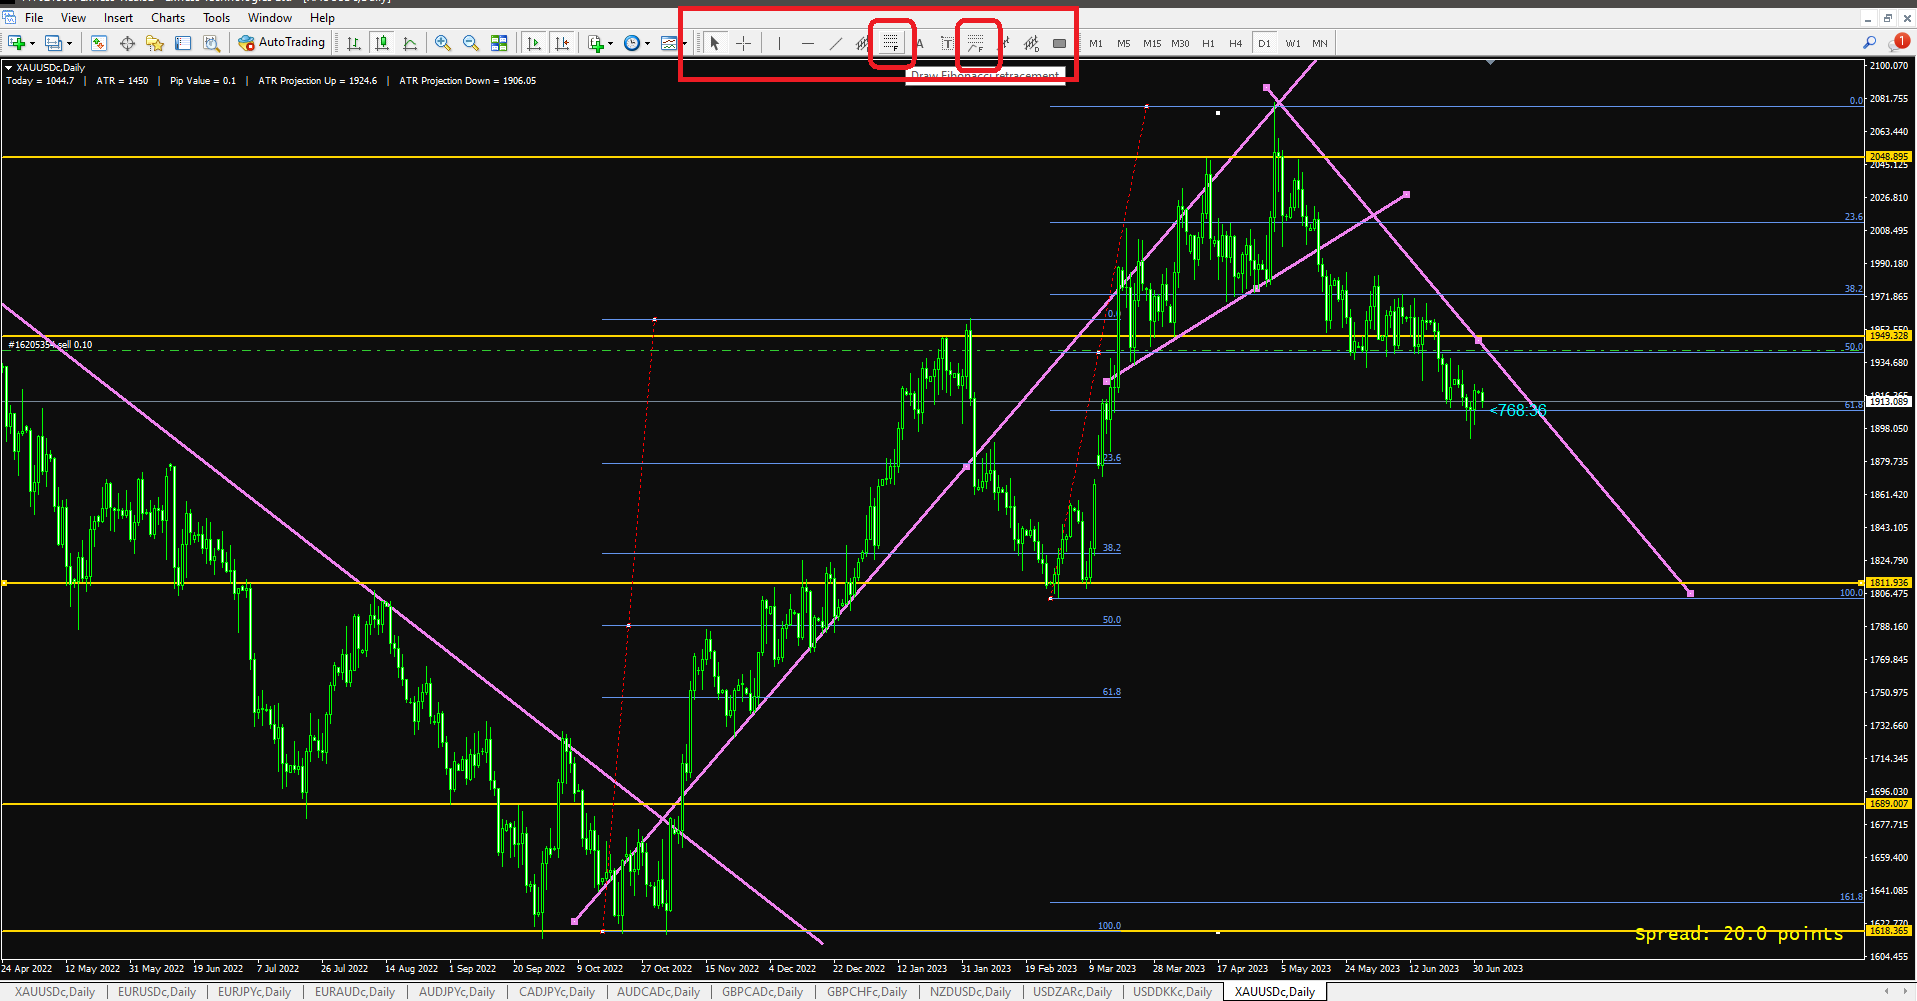
Drawing trendlines or price channels can help identify potential areas of resistance. A series of lower highs can indicate a descending resistance trendline.
Example: Google parent company Alphabet Inc. (GOOGL) Resistance Trendline GOOGL stock price repeatedly met resistance at a descending trendline, prompting a reversal and subsequent price decline.
Oscillators and Resistance Confirmation:
Oscillators like the Relative Strength Index (RSI) can confirm resistance levels when they show overbought conditions.
Example: Microsoft Corporation (MSFT) Resistance Confirmation An overbought RSI reading coincided with a resistance level at $300 for MSFT, leading to a price pullback.
Importance of Confluence:
What are Forex chart patterns and why it is essential?
Confluence occurs when multiple indicators or methods confirm the same support or resistance level. Combining different tools can enhance the accuracy of identifying critical price levels.
Example: Tesla Inc. (TSLA) Confluence TSLA stock faced a confluence of support at the $600 level, where the 200-day moving average and significant trading volume supported the price, leading to a strong upward movement.
Common Mistakes to Avoid:
- Overlooking Confirmation Signals: Relying on a single indicator without confirmation can lead to inaccurate support or resistance identification.
- Chasing Support and Resistance Levels: Acting too hastily on perceived levels without adequate analysis can result in poor trading decisions.
- Ignoring Market Sentiment: Failing to consider market sentiment can lead to misinterpreting support and resistance strength.
Tips for Enhancing Identification Accuracy:
- Using Multiple Timeframes: Analyzing support and resistance levels on different timeframes can provide a broader perspective.
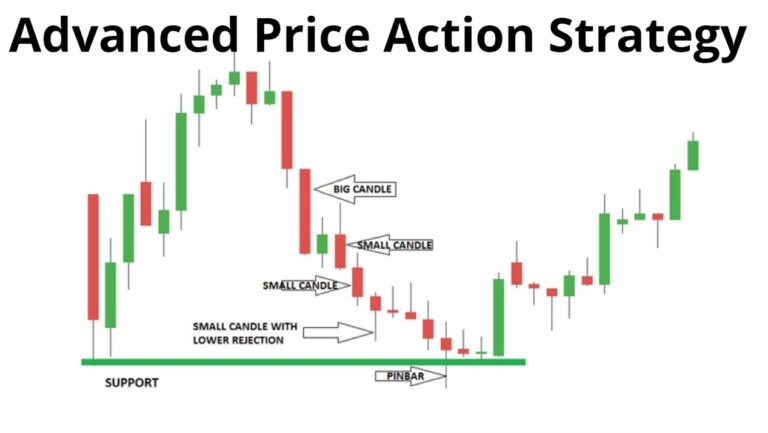
- Relying on Price Action: Combining price action analysis with indicators can validate support and resistance levels.
- Keeping Abreast of Market News: Staying informed about market events can help anticipate shifts in support and resistance levels.
Frequently Asked Questions
Q 1: What is technical analysis?
- Technical analysis is a method of evaluating financial assets by studying historical price and volume data to identify patterns, trends, and potential future price movements. It involves using various tools like charts, indicators, and oscillators to make informed trading decisions.
Q 2: How are support and resistance levels identified?
- Support levels are price points where an asset tends to stop declining due to increased demand, while resistance levels are price points where an asset tends to stop rising due to increased selling pressure. Traders identify these levels by analyzing historical price data, drawing trendlines, and using indicators like moving averages and volume analysis.
Q 3: What is the significance of support and resistance levels in trading?
- Support and resistance levels are crucial in trading as they help traders identify potential entry and exit points. Support levels act as buying opportunities, while resistance levels act as selling opportunities. Additionally, these levels provide insights into market sentiment and can help predict potential price reversals.
Q 4: How can I improve my technical analysis skills?
- To enhance your technical analysis skills, consider studying different chart patterns, mastering the use of various technical indicators, and analyzing price action. Practice historical data and keep up with market news to gain practical experience and refine your abilities.
Q 5: Can technical analysis guarantee profitable trades?
- While technical analysis is a valuable tool, it cannot guarantee profitable trades. Market conditions are influenced by various factors, including economic events and geopolitical developments. Technical analysis should be used in conjunction with risk management strategies and fundamental analysis for well-rounded trading decisions.
Conclusion to Identify Support and Resistance Levels in Technical Analysis
Mastering the identification of support and resistance levels is essential for any trader seeking to navigate the dynamic world of financial markets successfully. By understanding the characteristics, factors, and methods involved in recognizing these critical price levels, you can make more informed trading decisions. Remember to integrate multiple techniques and seek confluence to bolster your accuracy. With practice and real-life examples, you’ll be better equipped to interpret market trends and capitalize on potential opportunities. Happy trading!
Do you need a Deep Road Map for Forex learning? Structural Forex Trading Learning Road Map
Your opinion matters to us! We invite you to share your thoughts and insights on our latest blog post about identifying support and resistance levels in technical analysis. Whether you’re a seasoned trader, an aspiring investor, or simply interested in the world of finance, we’d love to hear your perspective. Have you encountered any unique real-life examples of support and resistance levels? Do you have any tips or tricks to add to our guide? Your comments and experiences can enrich the conversation and create a vibrant community of like-minded individuals. Join us in the comment section below and let’s engage in meaningful discussions together. We look forward to hearing from you!